Unemployment Far Worse in Lockdown States, Data Show

The novel coronavirus has done severe economic damage all over the globe. The Congressional Budget Office (CBO) stated on June 1, 2020 that it could take nearly a decade for the economy to grow back to levels forecasted this January. As economists, we want to understand just how much damage has been done to what people and sectors and how that damage was perpetrated. There’s usually more than one perp in a Depression.
First, the coronavirus obviously causes direct health effects that can impact economies. Note that economists like myself are not suggesting illness or death is bad primarily because of their economic effects; the social and personal costs of pandemics are devastating on their own.
Second, people voluntarily change their consumption, work, and personal behavior in reaction to pandemics, without the need for any intervention.
Third, political interventions like stay-at-home orders and business closures coercively change consumption, work and personal behaviors in ways that impact economies.
In this study, I’m interested mostly in the effects of political interventions. No one person can do much to affect mass, decentralized behavioral changes. But political officials taking advice from epidemiological and economic experts can directly and severely affect state and regional economies.
The numbers I use to track these intervention-based effects are state-specific insured unemployment claims from March 1, 2020 until May 9, 2020, the most recent reflected week at the time of writing. I group states by their lockdown status circa the most recent reflected week. Generally, I index insured unemployment rates to 0% on March 1, 2020, so what you’re seeing in these charts is the difference between the unemployment rates in each state reflecting the two weeks ending on March 1, 2020 and the unemployment rates in each state reflecting the two weeks ending on May 9, 2020.
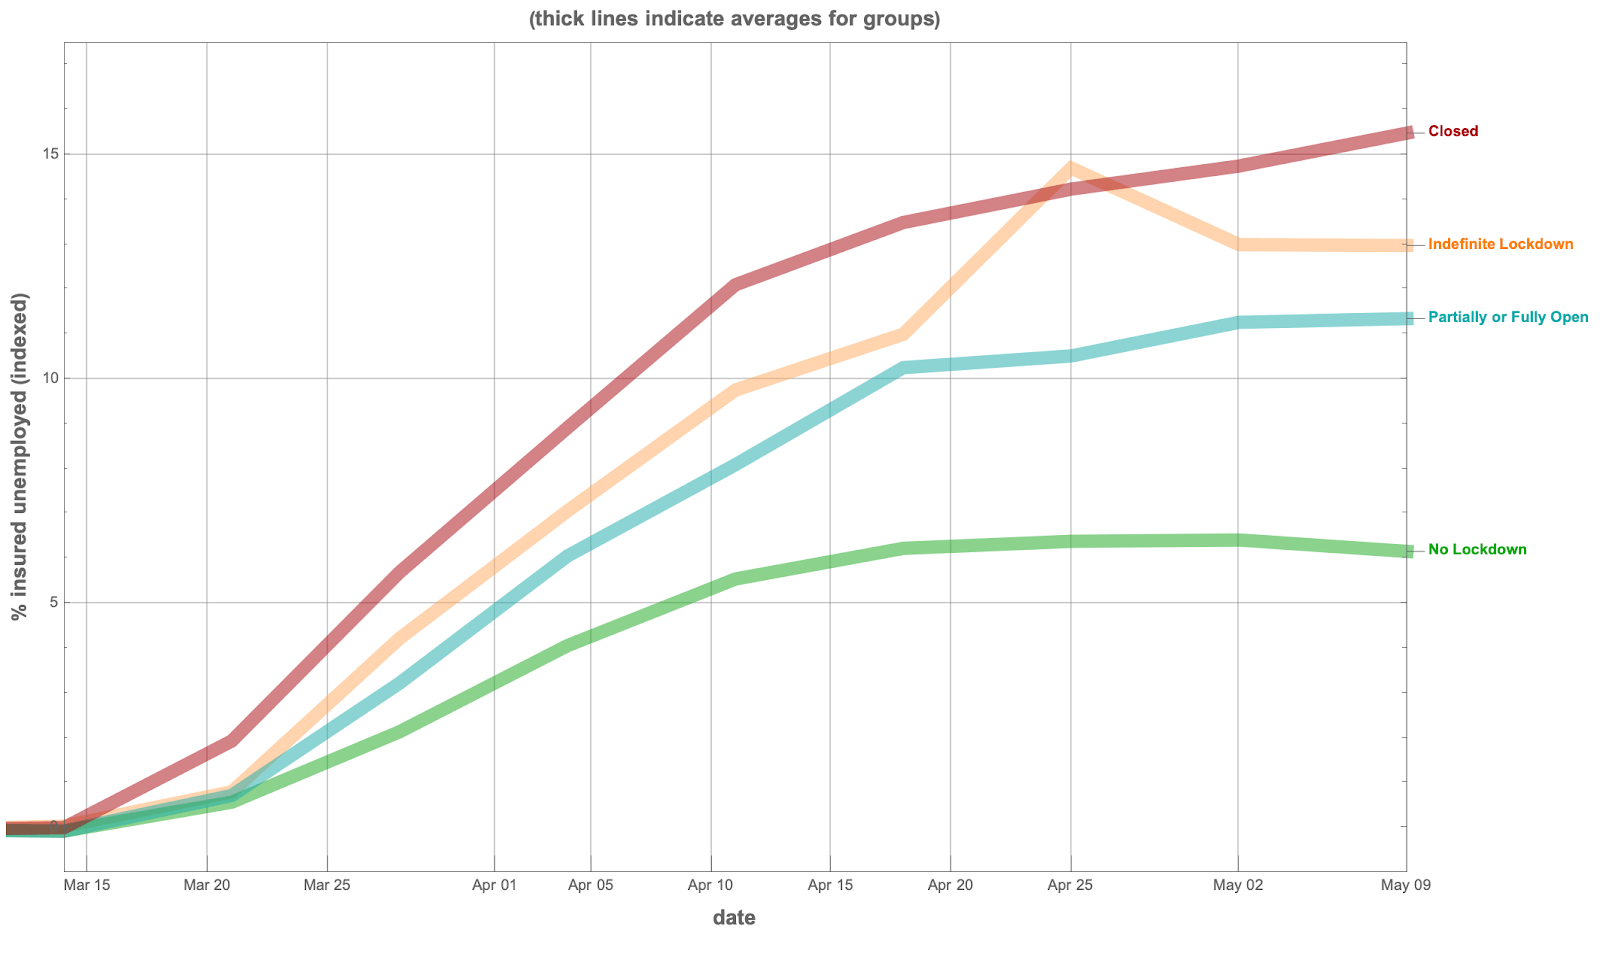
First, let’s look at the series for all states from March 15, 2020 (rates are extremely stable before that) and May 9, 2020. Each thin line is a state’s own series, colored by group. States locked down but with stated lockdown end dates are red, states locked down with no stated end dates are orange, states partially or fully reopened are blue, and states with no official lockdown are green. Thick lines in the series represent group averages.
Next, let’s take a look at each group. I start with states that were still locked down on May 9, since their group average (15.5% insured unemployed) is the highest of all the groups.
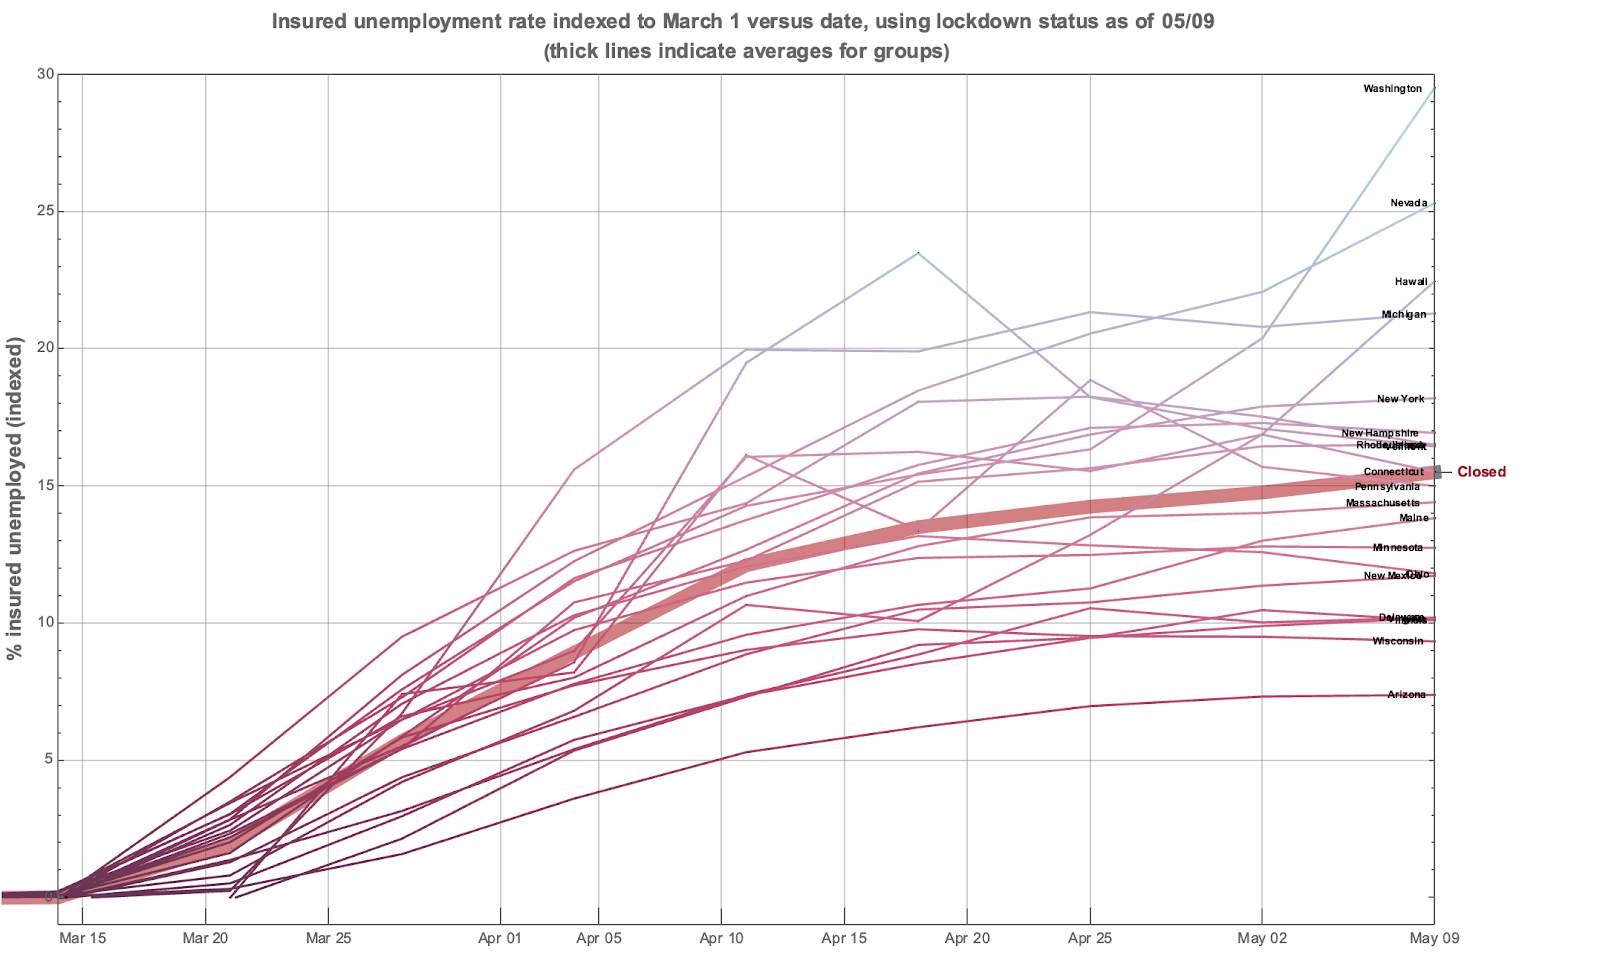 Washington (29.5% indexed to March 1 and 31.2% unindexed unemployment), Nevada (25.3% indexed to March 1 and 26.75% unindexed unemployment), and Hawaii (22.45% indexed to March 1 and 23.42% unindexed unemployment) have the highest levels of unemployment in the closed group.
In the next graph, I look at the states locked down on May 9 whose lockdowns didn’t have definitive end dates.
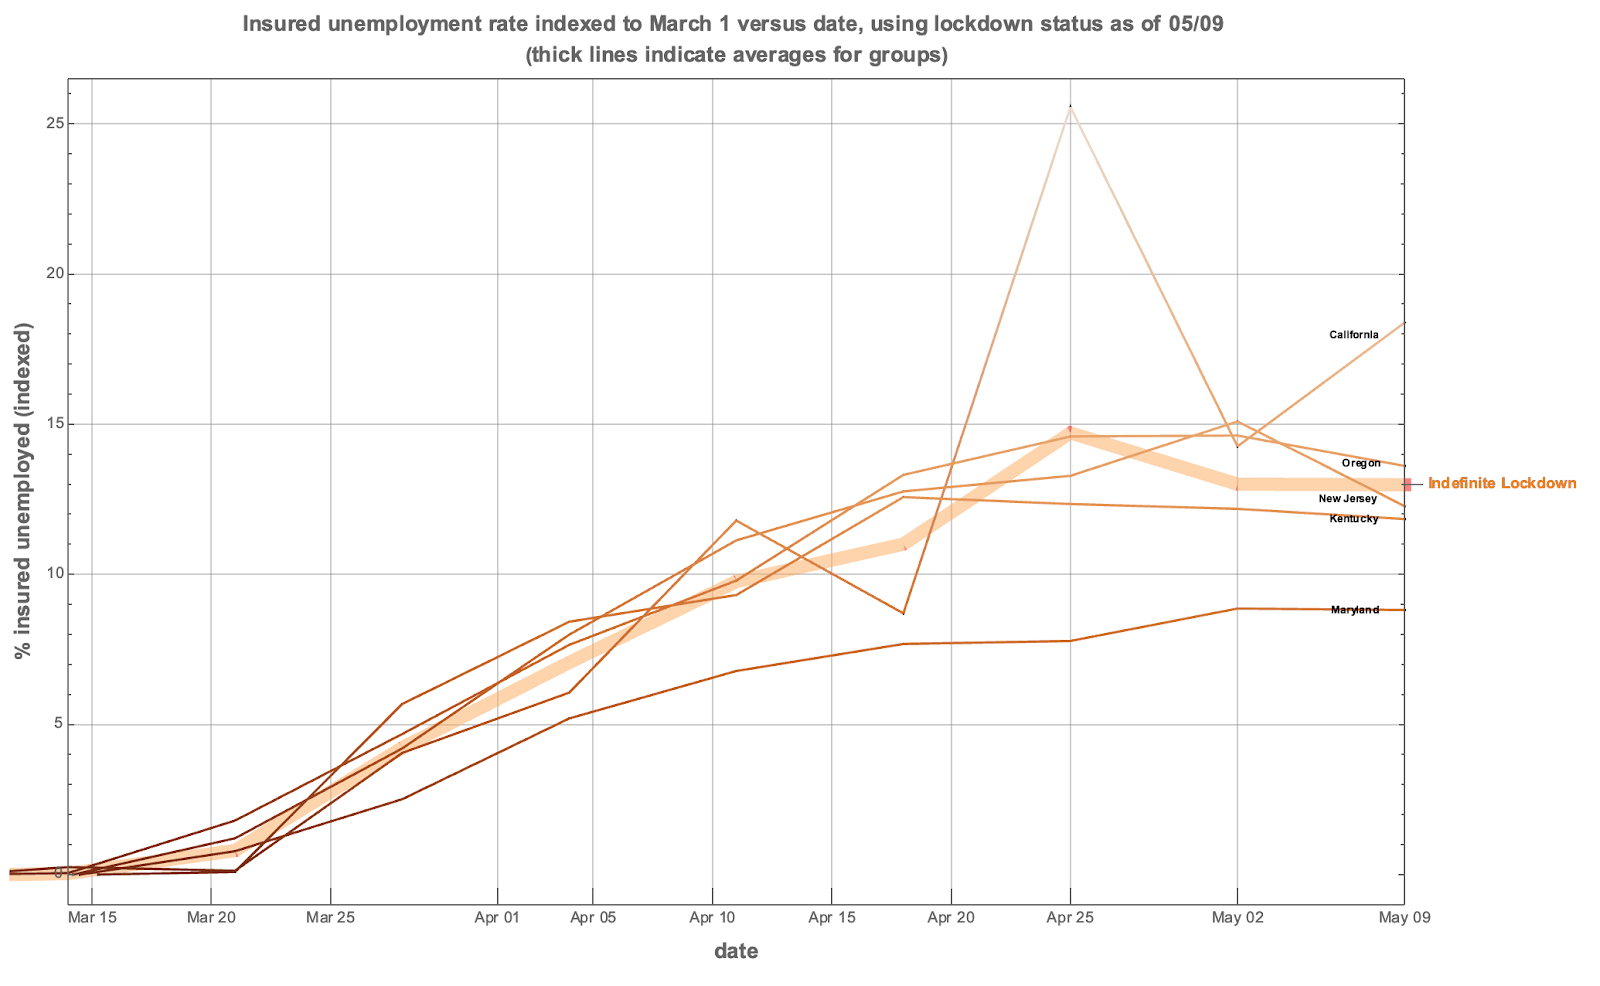 There aren’t many states in this group as of May 9. It’s important to note that some states started their lockdowns in March and April with indefinite lockdowns and by May 9 had formulated plans with on-paper end dates or phased reopenings.
The next graph looks at states amidst a partial or full reopening as of May 9. Note that this group consists of both states whose reopenings were weeks old and states whose reopenings were brand new as of May 9. For the sake of rigor I disincluded states that reopened on May 9, and kept those states in the “closed” group.
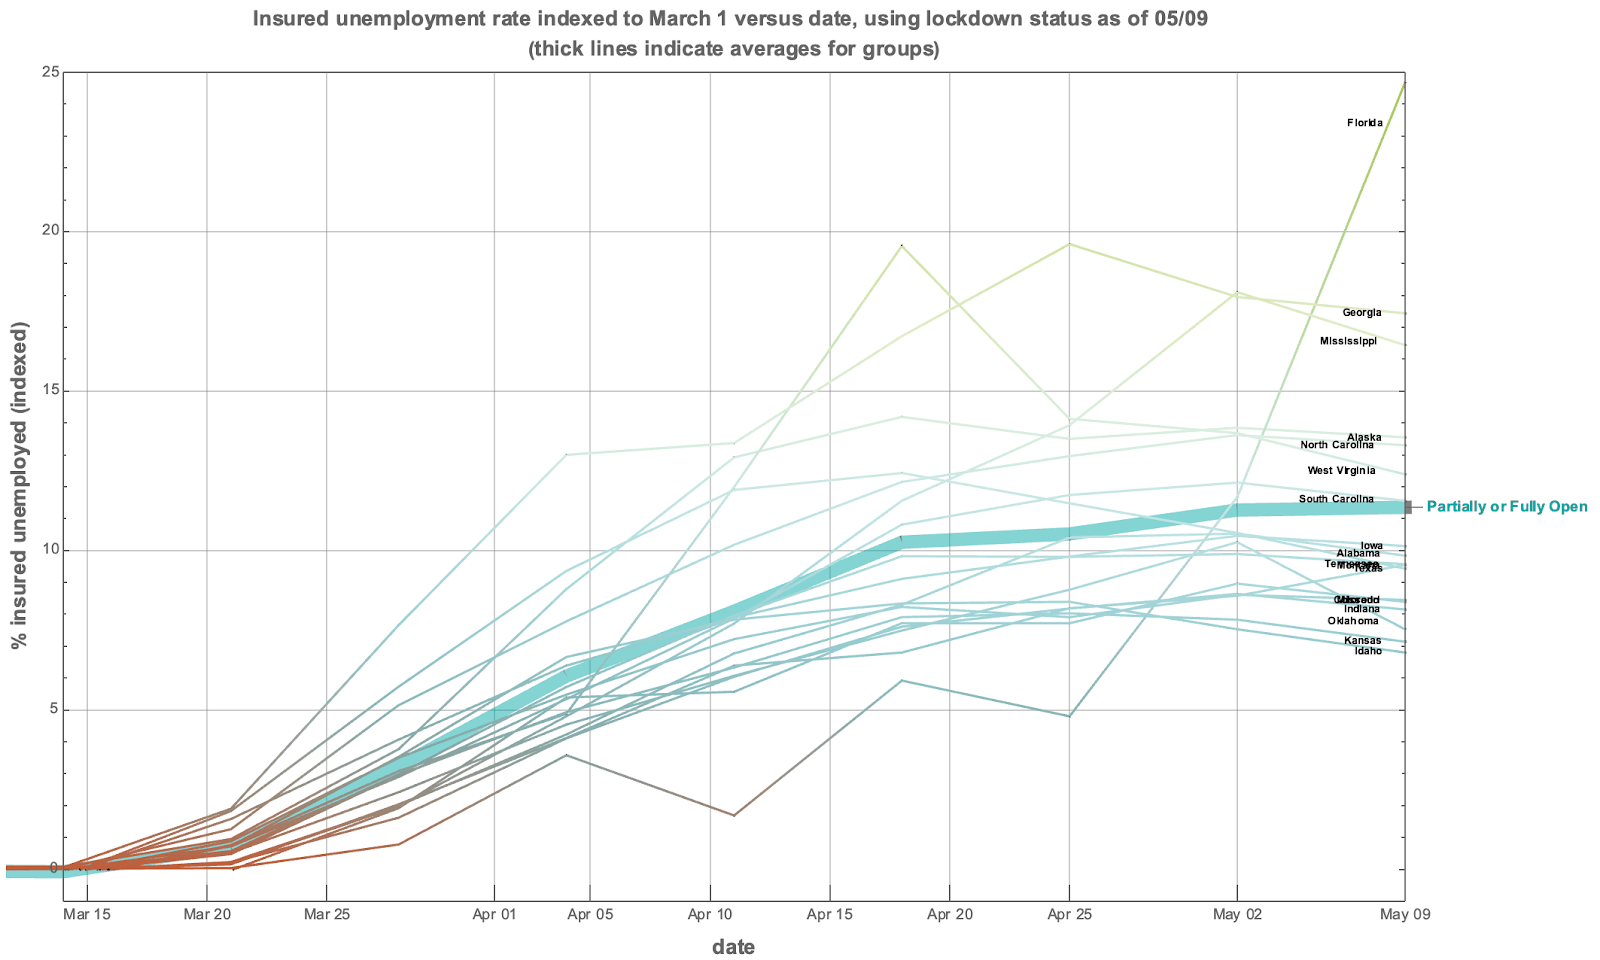 Florida is the obvious outlier of this graph, with 29.5% indexed to March 1 and 31.2% unindexed unemployment.
The final graph looks at the states with no formal shutdown orders, or what I call “no lockdown” states.
While the outlier of this small group, Arkansas, did not have a formal lockdown order, it did shut down restaurants, elective surgeries, casinos, venues and salons throughout the state.
Here are the group averages on their own graph:
What story do these graphs tell? An incomplete story, to be sure, like watching a very small part of a crime scene in which there are several perpetrators unfold before one’s eyes. Here’s a summary table of where group averages were on May 9:

In general, states that were still closed on May 9 had the highest average insured unemployment rates relative to the average for that same group on March 1. The unemployment rate of fully locked down states was at least double than states that had no formal lockdown. States that were fully or partially opened by May 9 fared better than fully locked down states, but as a group had almost double the average insured unemployment rate of states without a formal lockdown.
It’s important to issue a few caveats upon further study of this unfolding scene.
First: many states are still today (the beginning of June 2020) in the middle of reopening. Some states like Washington and Wisconsin have seen challenges (in the case of Wisconsin, successful) to their ongoing lockdown.
Second: there is no direct tradeoff between economic health and population-level health. It isn’t clear to what extent lockdowns will reduce COVID-19 fatalities and infections in the long run, as the imposition of general quarantines naturally slow the rate at which a population reaches herd immunity given that they are designed to slow the spread of the virus.
If general quarantines damage the economy enough to send it into its worst depression since the Great One our grandparents lived through, but do not significantly reduce fatalities and infections in the long run, get us foreseeably closer to a workable vaccine, or protect the most vulnerable in particular, then lockdowns might maximize economic pain for minimal health gains.
This is what the unemployment data seem to say at the moment. Economists should continue to look at this and other numbers for clues that can help us understand how best to put together the story of this unfolding scene, so that if some kinds of interventions turn out to be perpetrators instead of panaceas, we know to advise against employing them in the future.
*
Note to readers: please click the share buttons above or below. Forward this article to your email lists. Crosspost on your blog site, internet forums. etc.
Abigail is an incoming research fellow at the Institute for the Study of Economic Growth and assistant professor of economics at Wichita State University.
Featured image is from the author


