Three Charts: What Trump Doesn’t Want You to Know About the Climate Emergency

The Trump administration dropped the 1,000-page second volume of a congressionally-mandated study of the impact of the climate crisis on the United States late on Friday of Thanksgiving weekend in order to bury it. This sort of move is designed to make sure the report is not headline news on the networks, newspapers and social media on Monday morning, when big news items are seen by most Americans.
Trump and his cronies– I mean, cabinet– are deeply invested in or beholden to Exxon-Mobil and other Big Carbon firms who stand to lose billions if the public realizes the harm they are inflicting on us.
The problem? If we let them go on pushing out 41 billion metric tons of carbon dioxide a year throughout the world, it is going to cost the US hundreds of billion dollars a year by the end of the century. The economic contribution of entire states could be wiped out.
Unlike the unlamented Scott Pruitt’s EPA, which took down climate crisis web pages, this report is brutally honest:
- “Scientists have understood the fundamental physics of climate change for almost 200 years. In the 1850s, researchers demonstrated that carbon dioxide and other naturally occurring greenhouse gases in the atmosphere prevent some of the heat radiating from Earth’s surface from escaping to space: this is known as the greenhouse effect. This natural greenhouse effect warms the planet’s surface about 60°F above what it would be otherwise, creating a habitat suitable for life. Since the late 19th century, however, humans have released an increasing amount of greenhouse gases into the atmosphere through burning fossil fuels and, to a lesser extent, deforestation and land-use change. As a result, the atmospheric concentration of carbon dioxide, the largest contributor to human-caused warming, has increased by about 40% over the industrial era. This change has intensified the natural greenhouse effect, driving an increase in global surface temperatures and other widespread changes in Earth’s climate that are unprecedented in the history of modern civilization.”
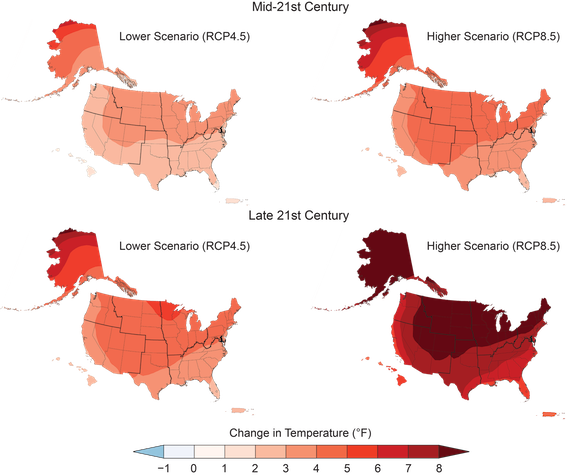
The projections of harm also pull no punches. In the worst case scenario of current models, the northeast and the midwest could have an average temperature 8 degrees F. warmer than today, with massive negative impacts on agriculture, diseases, forests and water.
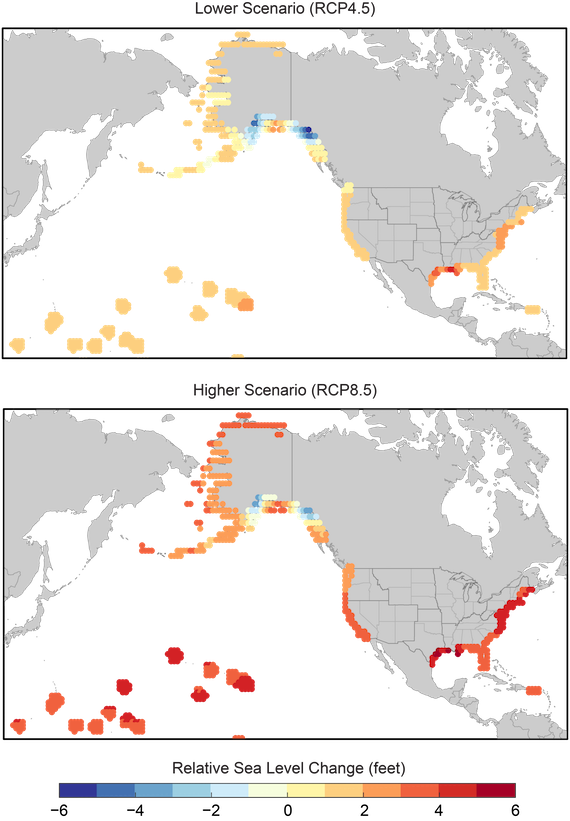
Sea level rise of as much as 4 feet by the end of the century will subtract vast amounts of coastal property from the country, costing billions and displacing potentially millions of people. Storm surges and flooding will damage billions of dollars of infrastructure along the coasts, as well.
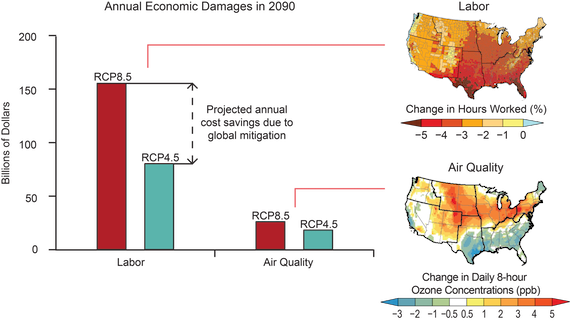
The extra heat will interfere with people working outdoors and will reduce man hours worked per year significantly. In other words, America is going to get much poorer, and the poor are going to be disproportionately hurt by the climate emergency.
“Figure 1.21: Annual economic impact estimates are shown for labor and air quality. The bar graph on the left shows national annual damages in 2090 (in billions of 2015 dollars) for a higher scenario (RCP8.5) and lower scenario (RCP4.5); the difference between the height of the RCP8.5 and RCP4.5 bars for a given category represents an estimate of the economic benefit to the United States from global mitigation action. For these two categories, damage estimates do not consider costs or benefits of new adaptation actions to reduce impacts, and they do not include Alaska, Hawaiʻi and U.S.-Affiliated Pacific Islands, or the U.S. Caribbean. The maps on the right show regional variation in annual impacts projected under the higher scenario (RCP8.5) in 2090. The map on the top shows the percent change in hours worked in high-risk industries as compared to the period 2003–2007. The hours lost result in economic damages: for example, $28 billion per year in the Southern Great Plains. The map on the bottom is the change in summer-average maximum daily 8-hour ozone concentrations (ppb) at ground-level as compared to the period 1995–2005. These changes in ozone concentrations result in premature deaths: for example, an additional 910 premature deaths each year in the Midwest. Source: EPA, 2017. Multi-Model Framework for Quantitative Sectoral Impacts Analysis: A Technical Report for the Fourth National Climate Assessment. U.S. Environmental Protection Agency, EPA 430-R-17-001.”
*
Note to readers: please click the share buttons above. Forward this article to your email lists. Crosspost on your blog site, internet forums. etc.
Juan Cole is the founder and chief editor of Informed Comment and Richard P. Mitchell Professor of History at the University of Michigan. He is author of, among many other books, Muhammad: Prophet of Peace amid the Clash of Empires. Follow him at @jricole.
All images in this article are from Informed Comment


