The Numbers Behind the Middle Eastern and North African Revolts

What determines which Middle Eastern or North African (MENA) countries will face revolt?
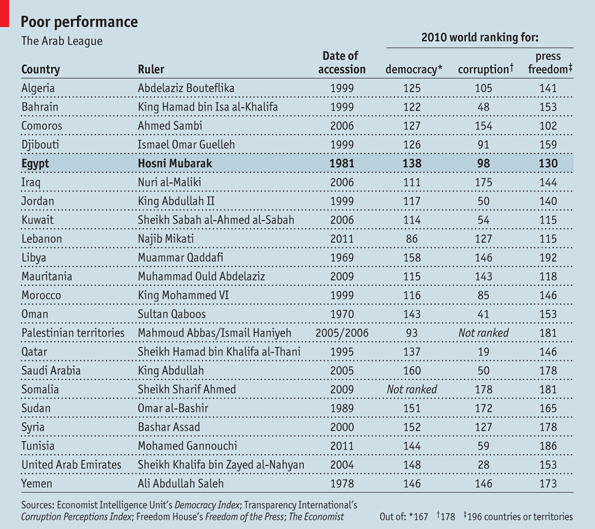
On February 3rd, the Economist came up with a list of “vulnerable” countries based upon the amount of democracy, corruption and press freedom:

Unemployment
But the Economist index doesn’t take unemployment into account.
As Alternet notes:
Arab Labour Organisation (ALO) figures show that Arab countries have among the highest unemployment rates in the world — an average of 14.5 percent in fiscal year 2007/08 compared with the international average of 5.7 percent. The rates may even be higher if one accepts unofficial estimates.
Global risk specialist Mi2g notes:
There are a lot of “orphans” and most are young – 65 percent of the population of the Arab League is under the age of 30. Youth unemployment rates are exorbitantly high – as high as 75 percent in some countries like Algeria. While the informal economy provides partial compensation, this does not provide security; the Jasmine Revolution was triggered by the self-immolation of a young man, Mohamed Bouazizi, unemployed after police confiscated his wheelbarrow, used to make ends meet by selling fruits and vegetables.
On February 2nd, Nomura published a report written by Steven Cook of the Council on Foreign Relations, arguing that youth unemployment and underemployment – along with a large proportion of youth – are primary factors driving revolt in the Middle East:
In both Tunisia and Egypt factors were at play which are also to be found in other economies in the region, notably:–An autocratic and corrupt regime [and] A significant―youth bulge and related unemployment and under-employment….
In other words, when there alot of young, unemployed (or under-employed) people, they might revolt.
Here are statistics from Nomura showing the percentage of youth under 15 years old and median age in years in the Middle East and Northern Africa:
Country
Population Aged <15>
Median Age (2010)
Algeria
27.0%
26.2%
Egypt
32.1%
23.9%
Iran
23.8%
26.8%
Iraq
40.7%
19.3%
Jordan
34.0%
22.8%
Libya
30.1%
26.2 %
Morocco
28.0%
26.2%
Saudi Arabia
32.0 %
24.6%
Syria
34.7%
22.5%
Tunisia
22.9%
29.1%
Yemen
43.4%
17.8%
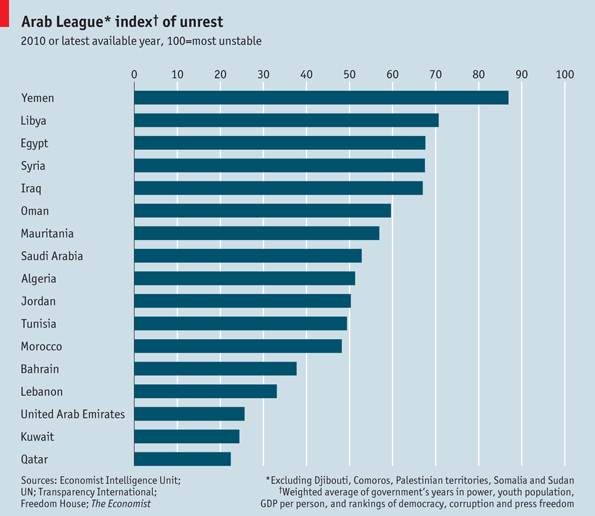
On February 9th, the Economist came up with a revised index, which they call the “shoe thrower’s index” (throwing one’s shoes at someone is the ultimate sign of disrespect in the Arab world).
The index gives a 35% weighting for the share of the population that is under 25; 15% for the number of years the government has been in power; 15% for both corruption and lack of democracy as measured by existing indices; 10% for GDP per person; 5% for an index of censorship and 5% for the absolute number of people younger than 25:

As a side note, youth unemployment is rising globally. As the New York Times reported last August:
Youth unemployment across the world has climbed to a new high and is likely to climb further this year, a United Nations agency said Thursday, while warning of a “lost generation” as more young people give up the search for work.
The agency, the International Labor Organization, said in a report that of some 620 million young people ages 15 to 24 in the work force, about 81 million were unemployed at the end of 2009 — the highest level in two decades of record-keeping by the organization, which is based in Geneva.
The youth unemployment rate increased to 13 percent in 2009 from 11.9 percent in the last assessment in 2007.
“There’s never been an increase of this magnitude — both in terms of the rate and the level — since we’ve been tracking the data,” said Steven Kapsos, an economist with the organization. The agency forecast that the global youth unemployment rate would continue to increase through 2010, to 13.1 percent, as the effects of the economic downturn continue. It should then decline to 12.7 percent in 2011.
***
In some especially strained European countries, including Spain and Britain, many young people have become discouraged and given up the job hunt, it said. The trend will have “significant consequences for young people,” as more and more join the ranks of the already unemployed, it said. That has the potential to create a “ ‘lost generation’ comprised of young people who have dropped out of the labor market, having lost all hope of being able to work for a decent living.
***
Data from Eurostat, the European Union’s statistical agency, show Spain had a jobless rate of 40.5 percent in May for people under 25.
Indeed, as I have previously pointed out, youth unemployment is also very high in the U.S. And when those who have given up looking for work and those who are underemployed are taken into account (i.e. using the U-6 measure of unemployment), it is clear that the youth of much of the world are suffering Depression-level unemployment.
Food
As many have noted, soaring food prices are also one of the main reasons for the revolts in Tunisia, Egypt, Bahrain, Yemen, Libya and elsewhere.
Nomura pointed out last September:
The World Bank (2009, p.11) estimates that nearly two-thirds of total income
is spent on food in the poor urban population of the developing world. High food prices reduce the ability to meet even basic needs and can lead to increased poverty and become a potential source of protests, riots and political tension ….
Alternet notes:
“Tunisians and Algerians are hungry. The Egyptians and Yemenis are right behind them,” Emirati commentator Mishaal Al Gergawi wrote in the Dubai- based newspaper Gulf News. “Mohammad Bouazizi didn’t set himself on fire because he couldn’t blog or vote. People set themselves on fire because they can’t stand seeing their family wither away slowly, not of sorrow, but of cold stark hunger.”
While Americans spend less than 15 percent of household expenditures on food, Egyptians spend 50%.
As UPI reports:
Just as in Tunisia, the spark was skyrocketing food prices — increasing at a brisk 17 percent annually in Egypt. That’s unhealthy in any economy but particularly one in which, as estimated by the investment house Nomura, on average 50 percent of household expenditures goes toward food. (In the United States, by comparison, food costs represent 14 percent — and falling — of the Consumer Price Index.)
For that, Egyptians may in no small way thank the U.S. Federal Reserve and its policies of “quantitative easing” — known by most as “printing money.”
Nomura prepared the following chart showing household spending on food as a percentage of income (I’ve bolded information on the MENA countries):
.nobrtable br { display: none }
Rank
Country
Nomura’s Food Vulnerability Index (NFVI)
GDP per
capita Current prices US$
Household
spending on
food % of total
consumption
Net food
exports
(% of
GDP)
1
Bangladesh
101.5
497
53.8
-3.3
2
Morocco
101.3
2,769
63.0
-2.1
3
Algeria
101.3
4,845
53.0
-2.8
4
Nigeria
101.2
1,370
73.0
-0.9
5
Lebanon
101.2
6,978
34.0
-3.9
6
Egypt
101.0
1,991
48.1
-2.1
7
Sri Lanka
101.0
2,013
39.6
-2.7
8
Sudan
100.9
1,353
52.9
-1.3
9
Hong Kong
100.9
30,863
25.8
-4.4
10
Azerbaijan
100.8
5,315
60.2
-0.6
11
Angola
100.8
4,714
46.1
-1.4
12
Romania
100.7
9,300
49.4
-1.1
13
Philippines
100.7
1,847
45.6
-1.0
14
Kenya
100.7
783
45.8
-0.8
15
Pakistan
100.6
991
47.6
-0.4
16
Libya
100.6
14,802
37.2
-1.7
17
Dominican Rep
100.6
4,576
38.3
-1.1
18
Tunisia
100.5
3,903
36.0
-1.1
19
Bulgaria
100.5
6,546
49.5
-0.1
20
Ukraine
100.5
3,899
61.0
0.9
21
India
100.4
1,017
49.5
0.3
22
China
100.4
3,267
39.8
-0.3
23
Latvia
100.4
14,908
34.3
-1.1
24
Vietnam
100.4
1,051
50.7
0.8
25
Venezuela
100.4
11,246
32.6
-1.0
26
Portugal
100.4
22,923
28.6
-1.8
27
Saudi Arabia
100.3
19,022
25.1
-1.8
28
Kazakhstan
100.3
8,513
44.7
0.1
29
Uzbekistan
100.3
1,023
34.7
-0.3
30
Russia
100.3
11,832
34.4
-0.7
31
Mexico
100.3
10,232
34.0
-0.5
32
Indonesia
100.2
2,246
47.9
1.0
33
Croatia
100.2
15,637
30.1
-0.9
34
Peru
100.2
4,477
31.8
-0.3
35
Greece
100.2
31,670
38.3
-0.7
36
Belarus
100.1
6,230
42.3
0.8
37
Slovenia
100.1
27,019
25.8
-1.3
38
Syria
100.1
2,682
47.9
1.5
39
Turkey
100.1
9,942
35.2
0.2
40
South Korea
100.1
19,115
23.1
-0.9
41
Colombia
100.1
5,416
28.0
0.0
42
South Africa
100.0
5,678
25.0
-0.1
43
Serbia
100.0
6,811
44.8
1.4
44
Czech Republic
100.0
20,673
27.4
-0.4
45
Lithuania
100.0
14,098
41.1
1.1
46
Guatemala
99.9
2,848
37.1
1.3
47
Slovakia
99.9
18,212
22.3
-0.4
48
Poland
99.9
13,845
32.1
0.7
49
Singapore
99.9
37,597
21.9
-1.0
50
Kuwait
99.9
54,260
30.0
-1.1
51
UK
99.8
43,541
22.5
-1.0
52
Israel
99.8
27,652
17.7
-0.5
53
Japan
99.7
38,455
19.8
-0.6
54
Italy
99.7
38,492
22.1
-0.3
55
Thailand
99.6
4,043
39.0
2.7
56
Hungary
99.6
15,408
29.4
1.6
57
Sweden
99.5
51,950
17.4
-0.7
58
Finland
99.5
51,323
20.5
-0.5
59
Germany
99.5
44,446
18.5
-0.3
60
Spain
99.5
35,215
21.8
0.4
61
Austria
99.5
49,599
19.5
-0.3
62
Ecuador
99.5
4,056
30.6
2.5
63
Switzerland
99.5
64,327
24.0
-0.5
64
Malaysia
99.5
8,209
37.1
2.9
65
France
99.5
44,508
22.0
0.2
66
Brazil
99.5
8,205
20.8
1.8
67
United States
99.3
46,350
13.7
0.2
68
Canada
99.3
45,070
18.0
0.6
69
Australia
99.2
47,370
19.7
1.1
70
Belgium
99.2
47,085
15.9
0.9
71
Chile
99.1
10,084
22.5
3.1
72
Ireland
99.1
60,460
25.8
1.5
73
Norway
99.0
94,759
16.9
-0.6
74
Luxembourg
99.0
109,903
19.1
-1.0
75
Costa Rica
98.9
6,564
30.6
4.7
76
Netherlands
98.9
52,963
13.3
1.6`
77
Denmark
98.8
62,118
16.8
1.8
78
Argentina
98.7
8,236
33.4
5.6
79
Uruguay
98.5
9,654
25.3
5.6
80
New Zealand
97.7
30,439
18.8
7.5
As should be noted, there are countries outside of MENA with extremely high percentages of spending on food.

