Study: Government’s Own Data Reveals that at Least 150,000 Probably Dead in U.S. Following COVID-19 Vaccines
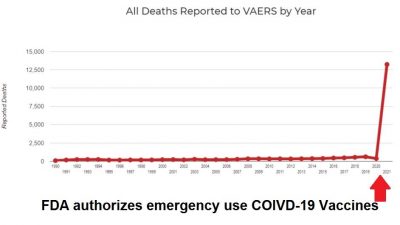
All Global Research articles can be read in 51 languages by activating the “Translate Website” drop down menu on the top banner of our home page (Desktop version).
Visit and follow us on Instagram at @crg_globalresearch.
***
This past weekend we published a report from the FDA’s Vaccine Advisory Committee meeting on Pfizer COVID-19 booster shots held on Friday, September 17, 2021, where dissenting doctors and researchers were able to present material showing how dangerous the COVID-19 vaccines are, going against the current corporate media narrative that has worked hard to suppress this data. See: BOMBSHELL: FDA Allows Whistleblower Testimony that COVID-19 Vaccines Are Killing and Harming People!
One of the presenters in that open session was Steve Kirsch, the Executive Director of the COVID-19 Early Treatment Fund, who stated that “expert analysis” revealed that over 150,000 people have died in the U.S. following a COVID-19 injection.
Well it appears that the “expert analysis” he was referring to was from Dr. Jessica Rose, who was also present at this committee meeting, and I included her 2 minute presentation as well in our report and in the video we compiled.
Dr. Jessica Rose has a BSc in Applied Mathematics and completed her MSc in Immunology at Memorial University of Newfoundland in Canada. She completed her PhD in Computational Biology at Bar Ilan University and then did her first Post Doctorate at the Hebrew University of Jerusalem in Molecular Biology.
I have retrieved the report she compiled which is located here, and I am reproducing it below as well. The Abstract states:
Abstract: Analysis of the Vaccine Adverse Event Reporting System (VAERS) database can be used to estimate the number of excess deaths caused by the COVID vaccines. A simple analysis shows that it is likely that over 150,000 Americans have been killed by the current COVID vaccines as of Aug 28, 2021.
If you are thinking that this is a simple analysis by using published comments from the past about what the percentages are for under-reporting vaccine adverse reactions, you would be making a false assumption.
This is maybe the most brilliant analysis of the VAERS data I have seen so far. What Dr. Rose did was take an independent analysis of a single VAERS event, one that the FDA and CDC admitted was an adverse reaction based on trials before the shots were even authorized, anaphylaxis, and then looked at independent studies reporting the rate of anaphylaxis to determine the true percentage, compared to what is actually being reported in VAERS.
What she found was that anaphylaxis was being under-reported in VAERS by 41X. Taking that variable and then applying it to other events, such as death, she arrived at the 150,000 death figure. See the full analysis below.
If this is a truer estimate of how many people are dying in the U.S. following COVID-19 shots, that means millions are dying worldwide due to these shots over the last 9 months.
Besides the plethora of anecdotal stories that we and others are reporting of formerly healthy people dying shortly after receiving a shot, one area where these massive amounts of deaths may show is in the labor force. Since so many employers are mandating these shots as a condition for employment, we would expect there to be massive labor shortages around the world as a result of these deaths.
And in fact, that is exactly what we are seeing, and the forecast for the immediate future is that these labor shortages are just going to get worse as now the U.S. has mandated that all federal employees and employees of companies employing more than 100 people must mandate a COVID-19 shot as a condition for employment, which means they will now reduce the labor force among the unvaccinated, just after the vaccinated have had massive casualties already negatively impacting the labor pool.
This is a global disaster that is probably unparalleled in human history!
Your Food Prices Are at Risk as the World Runs Short of Workers
by Bloomberg
Whether it’s fruit pickers, slaughterhouse workers, truckers or waiters, the world’s food ecosystem is buckling due to a shortage of staff.
Across the world, a dearth of workers is shaking up food supply chains.
In Vietnam, the army is assisting with the rice harvest. In the U.K., farmers are dumping milk because there are no truckers to collect it. Brazil’s robusta coffee beans took 120 days to reap this year, rather than the usual 90. And American meatpackers are trying to lure new employees with Apple Watches while fast-food chains raise the prices of burgers and burritos.
Whether it’s fruit pickers, slaughterhouse workers, truckers, warehouse operators, chefs or waiters, the global food ecosystem is buckling due to a shortage of staff. Supplies are getting hit and some employers are forced to raise wages at a double-digit pace. That’s threatening to push food prices — already heated by soaring commodities and freight costs — even higher. Prices in August were up 33% from the same month last year, according to an index compiled by the United Nations’ Food and Agriculture Organization. (Full story.)
So if we are facing labor shortages already due to a high rate of deaths and injuries from those who already received a COVID-19 shot, what is going to happen when we see massive layoffs of the unvaccinated in the next few weeks? Some police departments are already stating that they could lose up to half their force as so many officers would rather quit than take the shot.
What do you think is going to happen to the nation’s hospital system where many nurses who have refused the COVID-19 shots have already said they are willing to be fired when these mandates kick in?
I have been criticized by some for using the word “millions” in this article we published earlier this month: Crisis in America: Millions of Veteran Nurses are Resigning or Being Fired Over COVID Vaccine Mandates
But I am NOT exaggerating or using hyperbole when I use that word. Do the math people!!
There are about 4 million registered nurses in the U.S., about another million certified LPN/VPNs, close to another million CNAs, and then all the nursing assistants and other nurse support staff.
The corporate media in most locations are reporting that anywhere from 20 to 50% of these nursing employees are refusing the COVID-19 shots, while the nurses themselves claim that numbers are much higher, in some instances as high as 80% that are refusing the shots.
Remember, many of these work on the frontlines in ICUs and ERs, and so they KNOW how many people are actually dying and being injured by these shots, and it is totally reasonable that a large percentage of them value their own lives more than their jobs.
There are already reports of overcrowding in the nation’s ICUs, and the criminal health agencies are trying to blame this on the “unvaccinated” which is absurd!
As of last Friday, VAERS is reporting over 60,000 hospitalizations and over 80,000 visits to ERs following COVID-19 shots, and if the VAERS data is being under-reported by a factor of 41X, that means the real numbers are closer to 2.5 million hospitalizations, and 3.3 million trips to the ER following COVID injections.
We are looking at a potential worldwide major catastrophe facing us in the weeks ahead. See: We are Living Through the Greatest Scam and Cover-up in Human History – Are You Prepared for What Comes Next?
Here is Dr. Jessica Rose’s excellent research. Remember, this was submitted to the FDA and CDC and is now a matter of public record.
***
Estimating the number of COVID vaccine deaths in America
by Jessica Rose, Mathew Crawford
Abstract: Analysis of the Vaccine Adverse Event Reporting System (VAERS) database can be used to estimate the number of excess deaths caused by the COVID vaccines. A simple analysis shows that it is likely that over 150,000 Americans have been killed by the current COVID vaccines as of Aug 28, 2021.
The Vaccine Adverse Event Reporting System (VAERS) database is the only pharmacovigilance database used by FDA and CDC that is accessible to the public. It is the only database to which the public can voluntarily report injuries or deaths following vaccinations. Medical professionals and pharmaceutical manufacturers are mandated to report serious injuries or deaths to VAERS following vaccinations when they are made aware of them. It is a “passive” system with uncertain reporting rates. VAERS is called the “early warning system” because it is intended to reveal early signals of problems, which can then be evaluated carefully by using an “active” surveillance system.
The VAERS database can be used to estimate the number of deaths caused by the COVID vaccines using the following method:
1. Determine the significant adverse event under-reporting multiplier by using a known significant adverse event rate
2. Determine the number of US deaths reported into VAERS
3. Determine the propensity to report significant adverse events this year
4. Estimate the number of excess deaths using these numbers
5. Validate the result using independent methods
Determining the VAERS under-reporting multiplier
One method to discover the VAERS underreporting analysis can be done using a specific serious adverse event that should always be reported, data from the CDC, and a study published in JAMA. Anaphylaxis after COVID-19 vaccination is rare and occurs in approximately 2 to 5 people per million vaccinated in the United States based on events reported to VAERS according to the CDC report on Selected Adverse Events Reported after COVID-19 Vaccination. Anaphylaxis is a well known side effect and doctors are required to report it. It occurs right after the shot. You can’t miss it. It should always be reported.
A study at Mass General Brigham (MGM) that assessed anaphylaxis in a clinical setting after the administration of COVID-19 vaccines published in JAMA on March 8, 2021, found “severe reactions consistent with anaphylaxis occurred at a rate of 2.47 per 10,000” people fully
vaccinated. This rate is based on reactions occurring within 2 hours of vaccination, the mean time was 17 minutes after vaccination. This study used “active” surveillance and tried not to miss any cases.
When asked about this, both the CDC and FDA sidestepped answering the question. Here’s the proof at the CDC(see page 1 which incorporates the CDC response to the original letter on pages 2 and 3).
As noted in the letter, this implies that VAERS is underreporting anaphylaxis by 50X to 123X. The CDC chose not to respond to the letter.
Is the anaphylaxis under reporting rate a good proxy for reporting fatalities? Since anaphylaxis is such an obvious association, one could argue that the rate would be a lower bound. Others would argue that deaths are more important and would be more reported than anaphylaxis.
We don’t know, but it doesn’t matter because this is just an approximation to get to a ballpark figure. In general, most of us think It is therefore entirely reasonable to assert that deaths are reported even less frequently than anaphylaxis since deaths are not as proxmate to the injection event.
The MGH study used practically identical criteria as CDC used in its study to define a case of anaphylaxis. We ran the numbers ourselves and confirmed this.Therefore, a conservative estimate (giving the government the greatest benefit of the doubt) would use 50X as the underreporting rate.
However, after the MGH study was published, one doctor pointed out that doctors were more careful to avoid anaphylaxis; there was more careful screening of people likely to have anaphylaxis, and they were advised to see their allergist and take more precautions prior to
vaccination. This sort of thing would overstate the numbers above.
So we ran the numbers BEFORE the JAMA study appeared and got a more conservative estimate.
Here’s the data from Google (which uses World In Data):
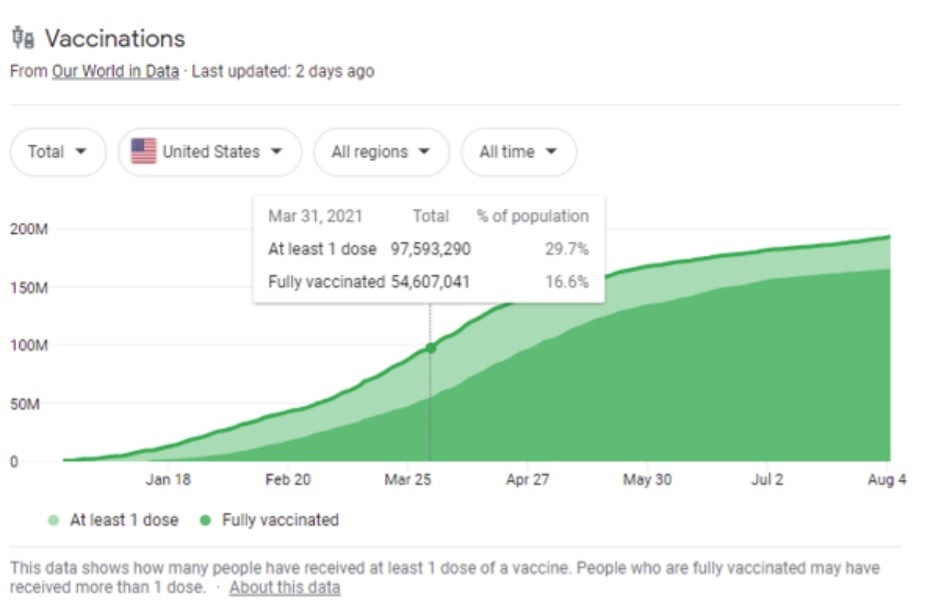
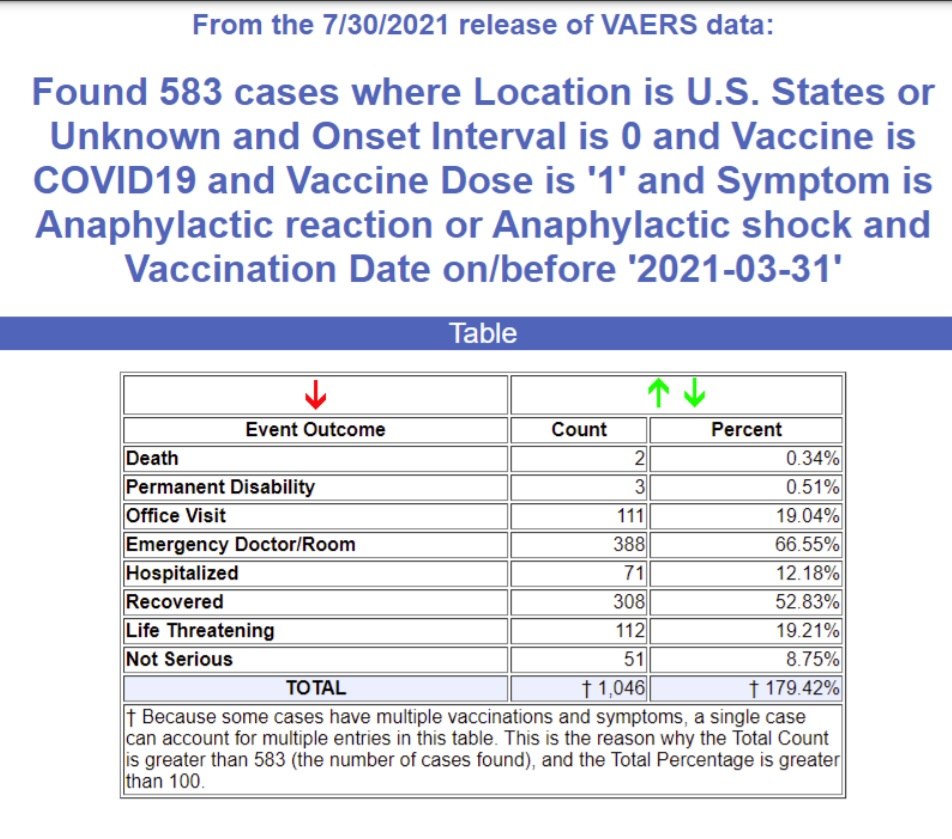
We’ve vaccinated 97.5M people from the start thru March 2021 and there were 583 reports in VAERS who had an anaphylaxis reaction on their first dose. This suggests that the underreporting rate is 41X.
Other estimates such as How Underreported Are Post-Vaccination Serious Injuries and Deaths in VAERS? suggests a 30X factor based on VAERS.
However, this used a serious adverse event rate from the Pfizer Phase 3 study which we believe under-reported these events for three reasons:
1) the patients were much healthier than average with a 10X lower rate of cardiac arrest than the general public (for example),
2) it was hard to report adverse events if you were in the trial (the evidence of this was unfortunately deleted when Facebook removed the vaccine side effect groups), and
3) there was known malfeasance in the reporting of adverse events in the 12-15 year old trial where the paralysis of 12-year-old Maddie de Garay was never included in the trial results and the FDA and CDC refused to investigate and the mainstream media would not report on it.
The point of this paper is not to find the exact number of deaths, but merely to find the most credible estimate for deaths. We think that anaphylaxis is an excellent proxy for a serious adverse event that, like a death, should always be reported so we think 41X is the most accurate number.
Our hypothesis is that this number will be applicable to deaths as well. In order to confirm our hypothesis, we must derive the death count in different ways and see if we come up with the same answer.
When used for less serious events, such as a headache, it’s likely that 41X is going to be low since such events are less likely to be reported. So our hypothesis is that 41X is a safe, conservative factor useful for both serious and less serious adverse events.
Determining the number of US deaths
As of August 27th, 2021, a search of the VAERS database shows that there are 7,149 domestic deaths in the VAERS database (US/Territories/Unknown).
Estimate the propensity to report for 2021
Healthcare providers have been required by law to report serious adverse events in VAERS with passage of the National Childhood Vaccine Injury Act (NCVIA) in 1986.
Therefore, nothing has changed this year vs. previous years:
1. no new legal requirements,
2. no noticeable promotion or incentives to report into VAERS.
Even when there are strong promotions to report adverse events as there was with H1N1 in 2009 where there were serious campaigns to raise the visibility of reporting, this didn’t impact the background fatality event reporting: it didn’t go up at all in 2009 and 2010 as can be seen from the graph below.
In short, it is extremely difficult to materially change the propensity to report serious adverse events into the VAERS system; it is remarkably consistent from year to year. This makes sense: old habits die hard… behaviors are hard to change. And there was nothing “new” this year to incentivize a massive change in behavior.
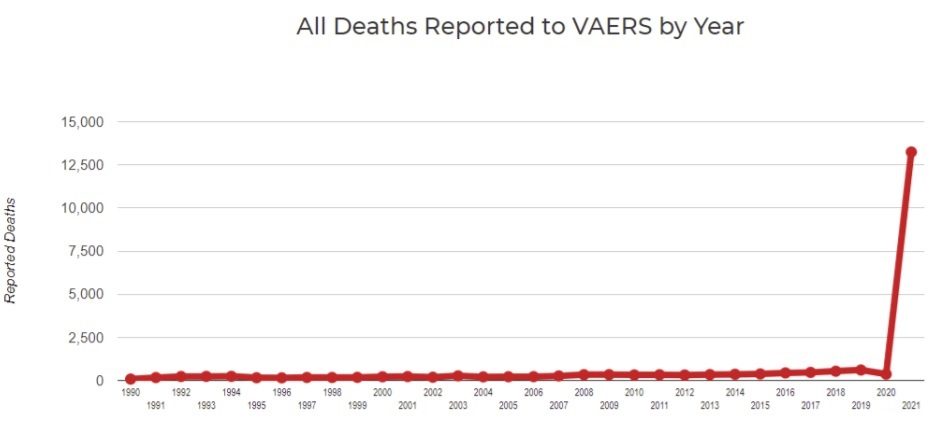
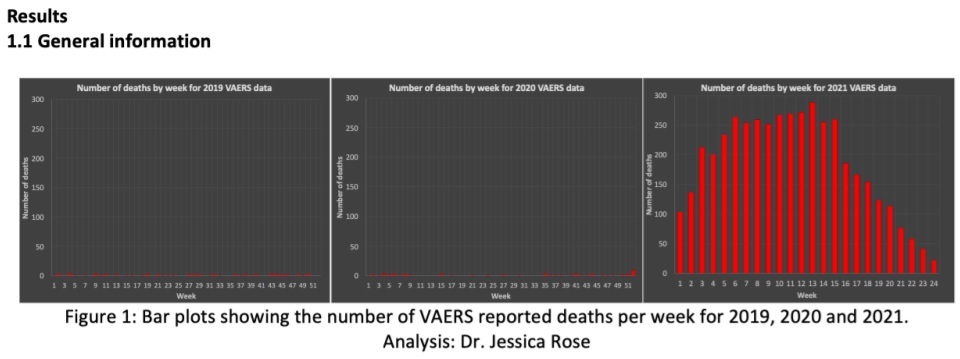
Look at the weekly data below. The massive increase in reporting pretty much happened almost instantaneously as soon as the vaccines started rolling out. And it was proportional to the rollout. That is not how behavioral change works… behavioral change would happen very lowly over time; especially if you are trying to get doctors to change their long term behaviors. The reporting basically followed the rollout of the vaccine. Doctors were more likely to report to VAERS this year because there were simply more events to report. We have verified that by talking directly to the doctors as the reason they are reporting more for these vaccines.
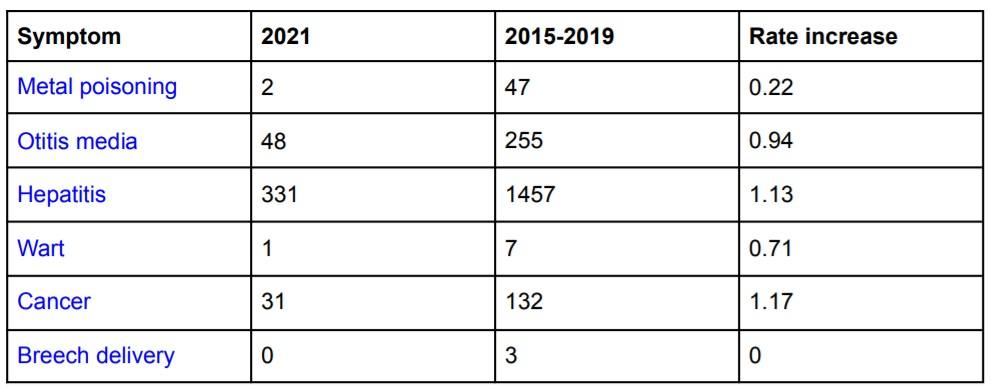
To double check our hypothesis that the propensity to report is unchanged this year, we ran VAERS queries using symptoms unrelated to those impacted by the vaccines. We ruled out any known comorbidities like diabetes and obesity since these would likely be elevated since there are more adverse events.
We found that the reporting rates for these unrelated events (listed in the table below) are no different this year than in previous years and for some of these events, the reporting rate is dramatically lower. Note that the number in the 2015-2019 column is the total for the 5 years, not an average annual amount. The Rate Increase is an X factor (i.e., A/B*5)
A third way to see that 2021 isn’t simply over-reporting normal background adverse events is to look at the “adverse event (AE) footprint” of the vaccine. You do that by listing adverse events on the X-axis and AE counts on the Y-axis. If there is over-reporting this year, the overall outline of the boxes will be exactly the same as previous years, and they will just be higher due to the higher propensity to report the same types of events. As you can see, that is not the case here.
This vaccine is definitely causing a completely different “shape” of severe adverse events. Here we show 2018, 2019, 2020, and 2021.
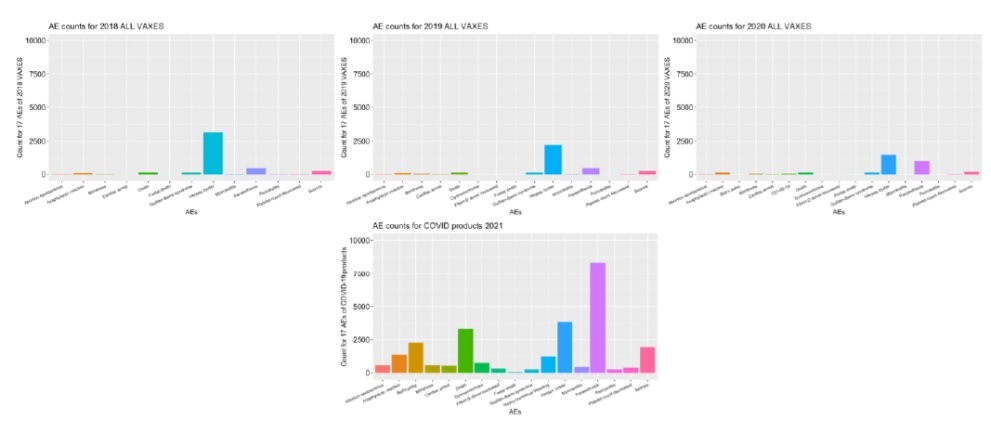
For a more detailed set of vaccine fingerprints (COVID vs. other vaccines), see these charts from Jessica Rose.
A fourth way to confirm there wasn’t over-reporting is through informal physician surveys.
In our informal physician surveys we saw a bias to under-report serious adverse events in order to make the vaccines look as safe as possible to the American public since most physicians believe they are hurting society if they do anything to create vaccine hesitancy.
Secondly, we’d estimate that at least 95% of physicians have completely bought into the “safe and effective” narrative and thus any event that they observe they deem as simply anecdotal and don’t bother to report it since it couldn’t have been caused by such a safe vaccine that appeared to do so well in the Phase 3 trials.
Determining the number of excess deaths caused by the COVID vaccines
There are three ways to estimate the number of excess deaths caused by the vaccine. Using these three methods we can estimate the low and high likely bounds for the number of excess deaths caused by the vaccine:
1. Subtract the average number of background deaths in previous years
2. Use 86% based on the analysis in the Mclachlan study
3. Use 40% based on the estimate of Dr. Peter Schirmacher one of the world’s top pathologists
Here is the result we get from the three methods:

In the first method, we used 500 background deaths as normal for a year since the propensity to report is the same this year as in previous years as shown earlier. However, we should assume that the age cohort is older this year than previous years. For example, here are the vaccination rates shown in a CDC report for influenza:
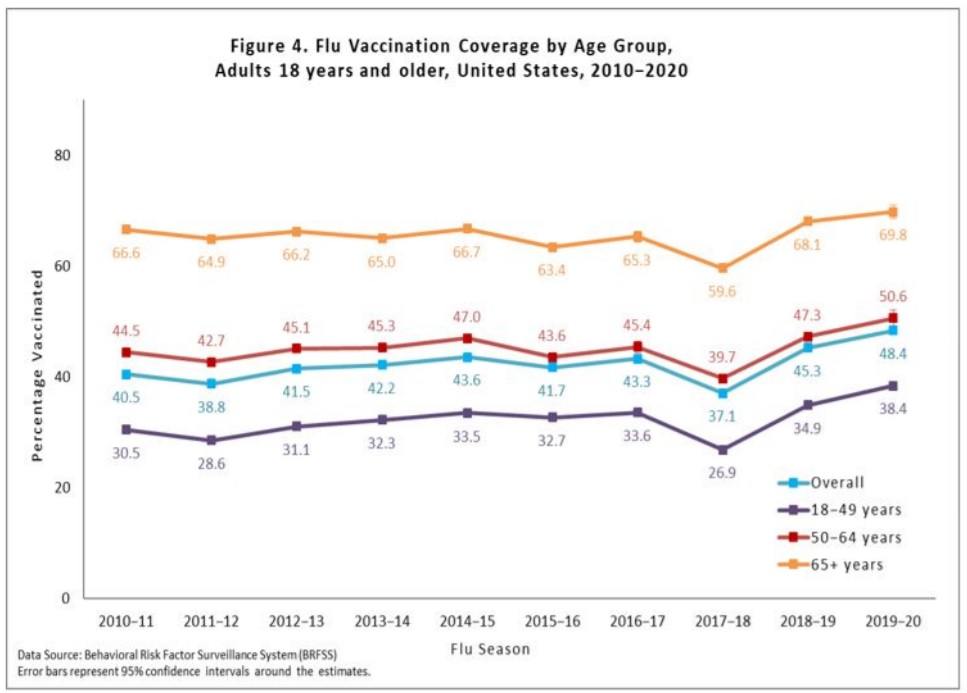
So a conservative estimate is to take the <500 deaths per year and increase it by 50% to more than account for a shift to higher ages so subtract 750 background deaths.
In the second method, McLachlan examined 250 VAERS reports in detail and concluded that up to 86% of the deaths were consistent with the vaccine being causal for the death. We use the higher number, because using a lower number makes no sense since it leads to a background death rate that would be excessive compared to previous years (.14*7149 = 1,000 which is already higher than the 500/yr background death rate).
The third method uses estimates made by Dr. Peter Schirmacher, one of the world’s top pathologists, for the % of deaths examined by autopsy within 2 weeks of the vaccine that were clearly caused by the vaccine.
The range was from 30% to 40% and we used the high end of the range since we believed that in making a potentially career-ending revelation such as this that Dr. Schirmacher was being extremely conservative and only estimating what he was 100% certain of proving.
40% is likely very conservative since Norway was under no such reputational pressure and in the the first 13 bodies they assessed, 100% of the deaths were found to be caused by the vaccine (see Norwegian Medicines Agency links 13 deaths to vaccine side effects). Therefore using a 60% number seems relatively conservative (less than the 65% average of 30 and 100).
Therefore we have a range of death estimates from 148,000 to 216,000 deaths which averages to 182,000 deaths.
Validation using other methods
In order to validate that our estimates are reasonable (or simply that the evidence was more likely consistent with the hypothesis that the vaccine does more harm than good), we looked at four different quantitative methods from very small to very large and summarized their estimates in the table:
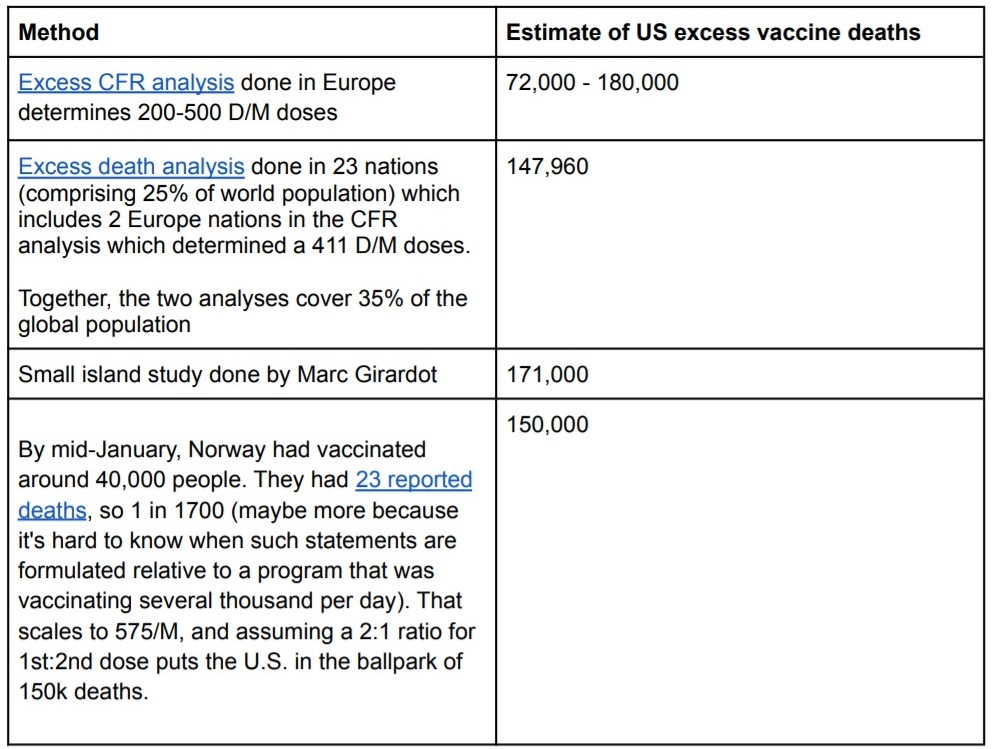
There are additional qualitative methods that show a large number of deaths. The point of these method is to show that the FDA assumption that “the vaccines are safe and all of the reports in VAERS are background events” is not even close to being true.
Example 5: The pericarditis data below shows that the number of events for these vaccines are anything but safe: they generate myocarditis/pericarditis at 860 times the rate of the typical flu vaccine in a year.
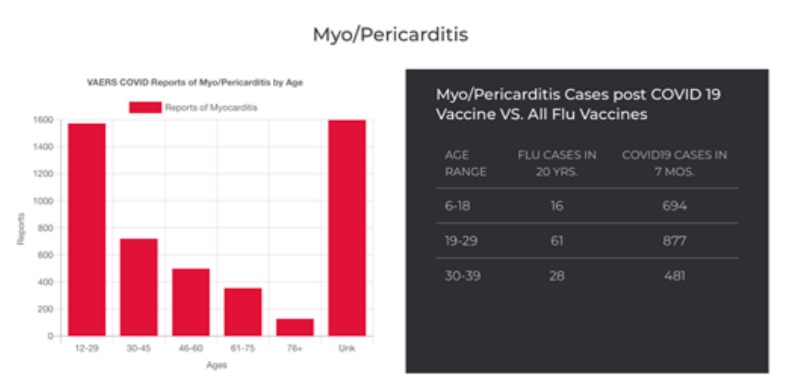
A friend of ours got pericarditis right after getting the influenza vaccine when she was 30 years old. It took her two years to recover. The heart muscle never really regenerates like other organs unfortunately.
Example 6: A total of 23 deaths have been reported in connection with the corona vaccination to the Norwegian Medicines Agency. Of those, 13 deaths were linked to the vaccine’s side effects. The other 10 haven’t been evaluated yet. Thus, 100% of the reported deaths have been deemed to be caused by the vaccine. If the vaccine is perfectly safe and has killed no one, then this is statistically impossible. Someone is lying. The fact that there are no autopsies being done in the US in public view suggests that it is more likely that the CDC is lying than the Norwegian Medicines Agency.
Example #7: An analysis of excess deaths in Israel, especially among young people, that was done by Dr. Steven Ohana, clearly shows a huge rise in excess deaths that have no explanation other than the rollout of a mass vaccination program.
Example #8: A published analysis of VAERS data by Dr. Jessica Rose and a more recent analysis of VAERS data done by Christine Cotton show massive numbers of cardiovascular and neurological adverse events occurring within temporal proximity to the injection date.
Example #9: Causality of these adverse events is confirmed using Dose 1 and Dose 2 studies done by Dr. Jessica Rose.
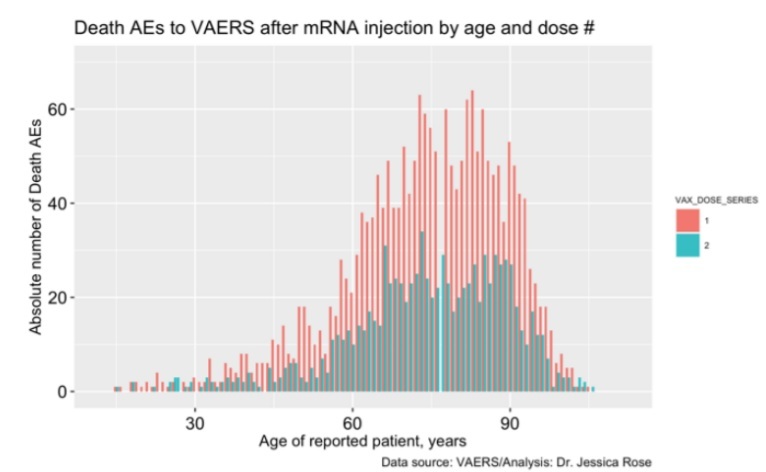
Example #10: If the vaccine is perfectly safe, the number of deaths would be equally likely after the first dose vs. the second dose since both are effectively “non-events.”
Because there are 15% fewer people who get the second dose than the first dose, we should expect the blue bars to be uniformly 15% lower than the red bars. This is not the case here. If the vaccine kills 50% of the 1% most vulnerable people each time it is administered, this can explain the dramatic drop off in events.
Another explanation is that the vulnerable population experienced severe adverse events following Dose 1 and thus chose not to get a second Dose despite the societal pressure (vaccine mandates, peer pressure, etc) to do so.
It is likely a combination of both effects. Here is an example of this from a comment posted to TrialSiteNews on A New Low For the FDA:
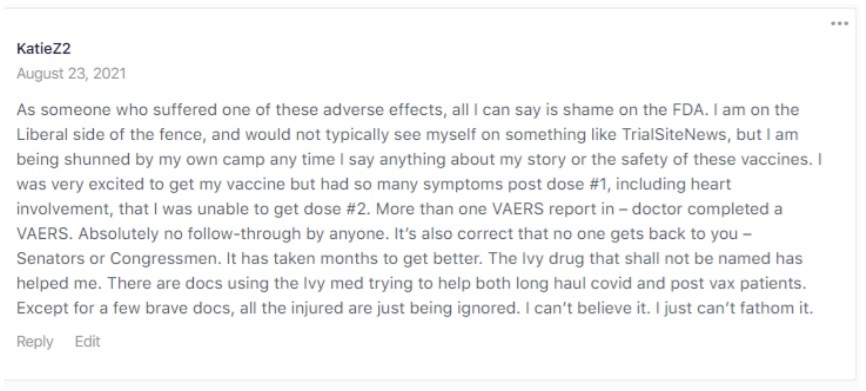
Whatever the cause, evidence to support the arisal and reporting of multiple severe adverse events that are dose-related is a very strong safety signal that requires investigation.
Example #11: The same commentary as before applies for cardiac arrest; a safe vaccine should have blue bars on average 15% below the red bars.
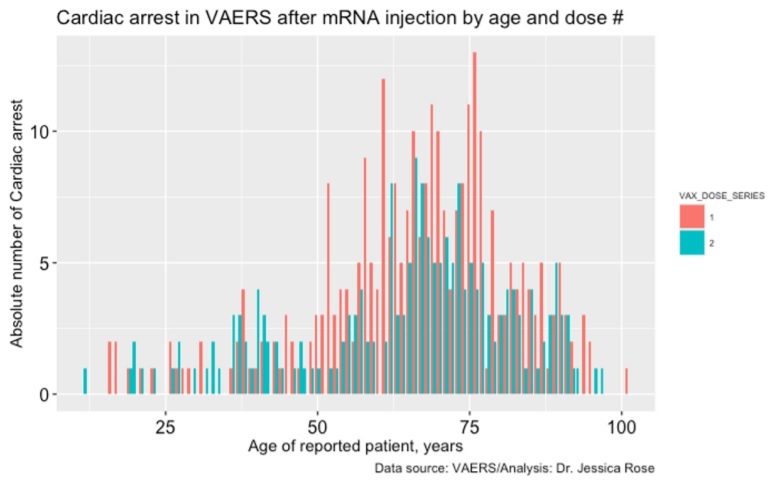
Example 12: Absolute numbers of VAERS reports plotted according to “time to death” is very revealing. We don’t know what the exact distribution of timing looks like because this was never measured. But we speculate that maximum accumulation of spike protein is achieved around 24 hours or so after injection and then it plateaus after that point as the mRNA disintegrates. Therefore, we would expect to see a death peak more than 24 hours after injection, i.e., on Day 1 and not on Day 0 This is exactly what happens in practice:
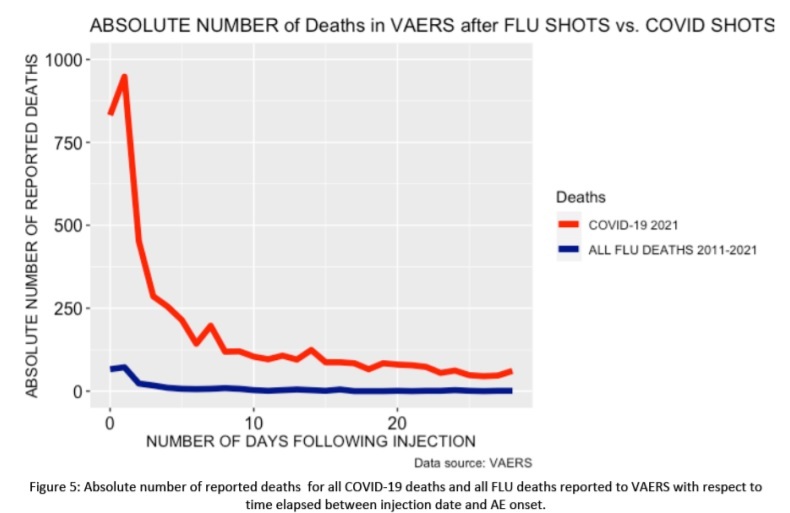
If these were simply random background deaths, we would expect to see a peak on the first day since that has the highest propensity to report, and it would drop from there; it would never peak on Day 1. In the graph above, we plot 8 months of the COVID19 vaccine reports compared to all death reports from all influenza vaccines for the past 10 years combined. So the blue line at 0 is 20 years of death reports, it is not an annual average. In short, the killing power of this vaccine is at least 200X greater than the influenza vaccine and probably a lot more than that since background deaths are included in both red and blue bars.
Furthermore, the shape of the two curves is completely different. The combined flu deaths are relatively flat with a slight rise in the first few days. The COVID vaccine generally kills people very quickly, and then gradually over time from there.
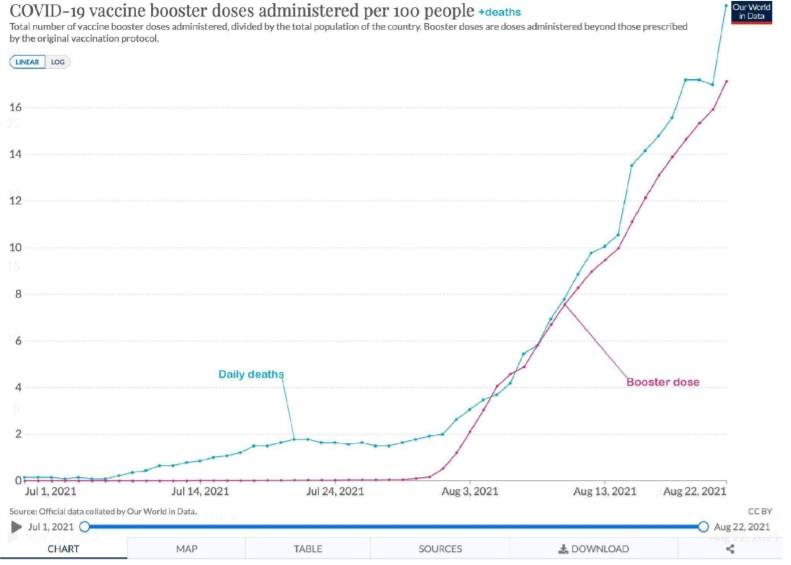
Example 13: A visual way to show that excess deaths are likely caused by the vaccine is to plot vaccinations and deaths on the same axis using data from the COVID-19 data explorer. For Israel we get this chart which shows a correlation between vaccine booster doses given
(cumulative booster doses per 100 people) and average daily deaths per million: they track almost in lock step.
This is hard to explain any other way.
In summary, the qualitative and quantitative confirmation techniques we used were all independent of each other and of our main method, yet all were consistent with the hypothesis that the vaccines cause large numbers of serious adverse events and excess deaths and are inconsistent with the null hypothesis that the vaccines have no effect on mortality and have a safety profile comparable to that of other vaccines.
We were not able to find a single piece of evidence that supported the FDA and CDC position that all the excess deaths were simply over-reporting of natural cause deaths.
Serious adverse events elevated by the COVID vaccines
We made a table comparing the rate of adverse events this year relative to the annual VAERS incidence rate reported for all vaccines over the period from 2015-2019 for ages 20 to 60.
We limited the age range to show that these events are affecting young people and not just the elderly. Also, the signal to noise ratio is much stronger in this younger age group since they are less likely to suffer “background” adverse events. A value of 473 means the rate reported in VAERS for the COVID19 vaccines in 2021 was 473 times higher than what is typical for all vaccines combined in the typical average year.
Nearly all serious adverse events we looked at were strongly elevated compared to the expected normal baseline event rate. This table is useful when assessing whether the vaccine may have been involved in causing death in cases.
The symptoms listed here are consistent with the presumed mechanism of action for how these vaccines kill people (producing spike protein throughout the body that cause inflammation, scarring, and blood clots).
Surprisingly, only a few of these symptoms appear in the labeling of the recently approved Pfizer vaccine. Thus, this table is important and timely.

Child deaths are consistent with symptoms elevated by the COVID vaccines
Perhaps most troubling of all is child deaths.
The CDC VAERS review of the 12-17 year old data released on July 30, 2021 showed there were 345 cases of myocarditis and 14 deaths. Unlike old people, kids don’t spontaneously die every day at anywhere near the same rate.
Using the table above and investigating each death, all of these deaths where there was sufficient detail in the death report showed that it involved one or more of the symptoms listed in the elevated adverse event table.
14*41 = 574 deaths
There are fewer total child deaths for 17 and under (which is a much wider age range than above) in the entire pandemic.
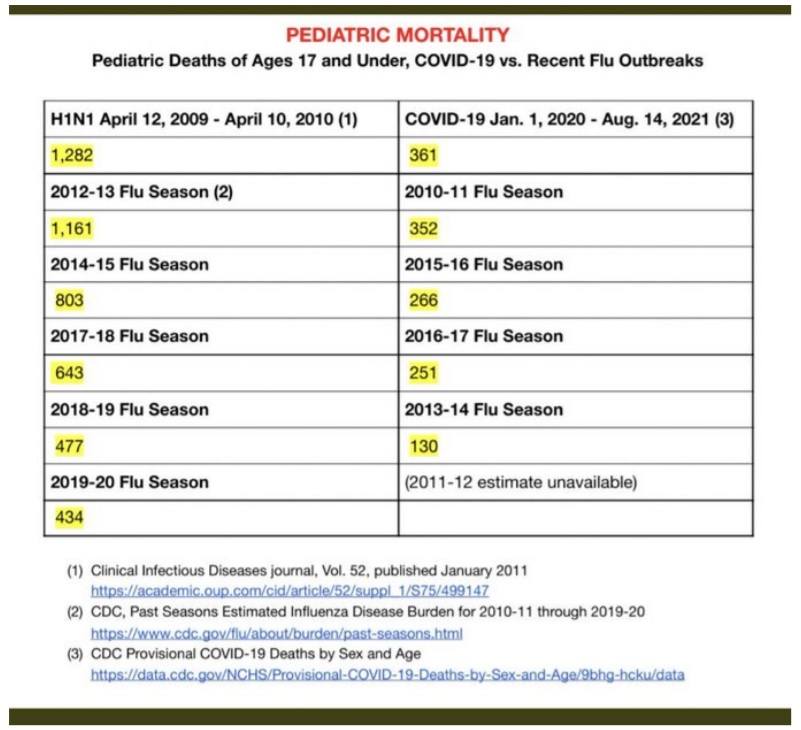
Therefore, the cost benefit case for children isn’t there.
Lack of a stopping condition
In 1976, they halted the H1N1 vaccine after 500 GBS cases and 32 people died.
However, there is no stopping mortality condition for these vaccines. We are likely at 150,000 deaths and counting and nobody in the mainstream medical establishment, mainstream media, or Congress is raising any concerns.
No member of the medical community is calling for any stopping condition nor autopsies. We find this troubling.
Negative efficacy
This paper shows that the vaccines we received may well shortly become completely useless to protect us and, to make matters worse, might enhance the ability of future variants to infect us due to vaccine enhanced infectivity/replication, rather than “classical” ADE.
In short, even if the vaccine were perfectly safe and killed no one, it’s rapidly becoming a net negative based on efficacy alone.
We are starting to see evidence of this today. UK data destroys entire premise for vaccine push. August 21. 2021. “Again, 402 deaths out of 47,008 cases or 0.855% CFR in fully vaccinated, and; 253 deaths out of 151,054 cases or 0.17% CFR in unvaccinated. If you get Covid having been fully vaccinated, according to this UK data, you are five (5) times more likely to die than if you were not vaccinated!”
All-cause mortality is the single most important thing to focus on and it’s not there
Today, most people focus on the relative risk reduction of the vaccines against infection, hospitalization death from COVID. They pay less attention to the absolute risk reduction from COVID. And they pay no attention at all to the absolute all-cause mortality benefit.
The funny thing is that we should be paying attention to these in the opposite order that we listed them.
All-cause mortality is key. If there is no improvement in all-cause mortality, nothing else matters.
In short, say our vaccine reduces the risk of dying from COVID by 2X. But it came at a cost, e.g., increasing your risk of dying from a heart attack by 4X. And let’s say both events are equally likely (which they aren’t). Then you’ve made a bad decision… you’re more likely to die if
you took the vaccine.
Here are the results from the Pfizer 6-month study:

Discussion of these results is quite a bit more complex than we have space to go into here, but these are the basic stats. For more information, see the 10-page discussion of the Pfizer 6 month trial at Why so many Americans are refusing to get vaccinated.
All the all cause mortality numbers are negative from the 6 month Pfizer study. This is not a surprise: it is caused by the high rates of adverse events we’ve already discussed.
There is no evidence of statistically significant mortality improvement.
If there was the CDC, FDA, and NIH would certainly let us know. But just the opposite happened: when the Pfizer 6 month study came out, the mainstream media and mainstream medical scientists were silent on the lack of all-cause mortality evidence. It didn’t even make it into the abstract. The fact that 4 times as many people were killed by cardiac arrest wasn’t even mentioned.
When you combine (1) the negative efficacy of the vaccine with (2) the negative all-cause mortality benefit, it’s impossible to justify vaccination. Either alone is sufficient to kill the benefit; both of them together makes things even more difficult for recommending vaccination.
The bottom line is clear: If you got the vaccine you were simply more likely to die. The younger you are, the greater the disparity.
Early treatment using repurposed drugs has always been the safer and easier way to treat COVID infections
Early treatment protocols such as those used by Fareed and Tyson have been shown to provide more than a 99% relative risk reduction, work for all variants, and the drugs don’t maim or harm the recipients. It is baffling that we are ignoring these treatments and waiting for more evidence when we have a vaccine which appears to kill more people than it saves, soon will be completely useless against future variants, and is likely going to make things worse for the recipient by enhancing replication and/or infectivity.
There are also a variety of prophylaxis techniques that are simple, safe, and highly effective including. The precautionary principle suggests that if there is evidence from a credible source of the benefits of these treatments (which there are), that doctors.
Because early treatments using repurposed drugs don’t create a measurable risk of death, the all-cause mortality for early treatments is always positive.
Many people assume that vaccination is the only path forward. It isn’t. Allowing people to be infected and develop recovered immunity leads to immunity which is broader against variants and lasts longer. See “Recovered immunity is broader and longer lasting” in this document.
It is instructive to compare Israel with India.
Israel is one of the most vaccinated countries on Earth with 80 percent of citizens above the age of 12 fully inoculated. As of Aug 24, 2021, Israel reported 9,831 new diagnosed cases on Tuesday, a hairbreadth away from the worst daily figure ever recorded in the country—10,000—at the peak of the third wave.
At the same time, India recorded 354 deaths in a day, Israel was reporting 26 deaths and record high cases. Here’s how they stack up:

Obviously, India has 11.6X lower deaths per capita than Israel.
The conclusion is clear, vaccination is not the only solution nor the best solution.
Summary
Using the VAERS database and independent rates of anaphylaxis events from a Mass General study, we computed a 41X under-reporting factor for serious adverse events in VAERS, leading to an estimate of over 150,000 excess deaths caused by the vaccine.
The estimates were validated multiple independent ways.
There is no evidence that these vaccines save more lives than they cost. Pfizer’s own study showed that adverse events consistent with the vaccine were greater than the lives saved by the vaccine to yield a net negative benefit. Without an overall statistically significant all-cause mortality benefit, and evidence of an optional medical intervention that has likely killed over.
150,000 Americans so far, vaccination mandates are not justifiable and should be opposed by all members of the medical community.
Early treatments using a cocktail of repurposed drugs with proven safety profiles are a safer, more effective alternative which always improves all-cause mortality in the event of infection and there are also safe, simple, and effective protocols for prophylaxis.
Download this article as a .pdf here.
Watch Dr. Rose’s other presentation on the VAERS data published in May, 2021: Study: Analysis of VAERS Shows the COVID Shots are Likely Cause of Deaths, Spontaneous Abortions, Cardiovascular, Neurological, and Immunological Adverse Events
*
Note to readers: Please click the share buttons above or below. Follow us on Instagram, @crg_globalresearch. Forward this article to your email lists. Crosspost on your blog site, internet forums. etc.
All images in this article are from the authors unless otherwise stated

