Investigating the Mass Hysteria Over 1 Degree in Climate Change Since 1850
Let's discuss the Physical Science Basis for Climate Change and the media hype over the report.

All Global Research articles can be read in 51 languages by activating the “Translate Website” drop down menu on the top banner of our home page (Desktop version).
Visit and follow us on Instagram at @crg_globalresearch.
***
Inquiring minds are diving into the latest report by the Intergovernmental Panel on Climate Change.
Please consider the Climate Change 2021 Report, the Physical Science Basis.
Key Snips
- Global surface temperature was 1.09 [0.95 to 1.20] °C higher in 2011– 2020 than 1850–1900, with larger increases over land (1.59 [1.34 to 1.83] °C) than over the ocean (0.88 [0.68 to 1.01] °C). The estimated increase in global surface temperature since AR5 is principally due to further warming since 2003–2012 (+0.19 [0.16 to 0.22] °C). Additionally, methodological advances and new datasets contributed approximately 0.1ºC to the updated estimate of warming in AR6
- The likely range of total human-caused global surface temperature increase from 1850–1900 to 2010–2019 is 0.8°C to 1.3°C, with a best estimate of 1.07°C.
- Global mean sea level increased by 0.20 [0.15 to 0.25] m between 1901 and 2018. The average rate of sea level rise was 1.3 [0.6 to 2.1] mm yr between 1901 and 1971, increasing to 1.9 [0.8 to 2.9] mm yr between 1971 and 2006, and further increasing to 3.7 [3.2 to 4.2] mm yr between 2006 and 2018 (high confidence).
- In 2011–2020, annual average Arctic sea ice area reached its lowest level since at least 1850 (high confidence). Late summer Arctic sea ice area was smaller than at any time in at least the past 1000 years (medium confidence). The global nature of glacier retreat, with almost all of the world’s glaciers retreating synchronously, since the 1950s is unprecedented in at least the last 2000 years (medium confidence).
- It is likely that the global proportion of major (Category 3–5) tropical cyclone occurrence has increased over the last four decades, and the latitude where tropical cyclones in the western North Pacific reach their peak intensity has shifted northward; these changes cannot be explained by internal variability alone (medium confidence). There is low confidence in long-term (multi-decadal to centennial) trends in the frequency of all-category tropical cyclones.
- Global surface temperature will continue to increase until at least the mid-century under all emissions scenarios considered. Global warming of 1.5°C and 2°C will be exceeded during the 21st century unless deep reductions in CO2 and other greenhouse gas emissions occur in the coming decades.
- It is very likely that heavy precipitation events will intensify and become more frequent in most regions with additional global warming. At the global scale, extreme daily precipitation events are projected to intensify by about 7% for each 1°C of global warming (high confidence).
- It is virtually certain that global mean sea level will continue to rise over the 21st century. Relative to 1995-2014, the likely global mean sea level rise by 2100 is 0.28-0.55 m under the very low GHG emissions scenario (SSP1-1.9), 0.32-0.62 m under the low GHG emissions scenario (SSP1-2.6), 0.44-0.76 m under the intermediate GHG emissions scenario (SSP2-4.5), and 0.63-1.01 m under the very high GHG emissions scenario (SSP5-8.5), and by 2150 is 0.37-0.86 m under the very low scenario (SSP1-1.9), 0.46- 0.99 m under the low scenario (SSP1-2.6), 0.66-1.33 m under the intermediate scenario (SSP2-4.5), and 0.98-1.88 m under the very high scenario (SSP5-8.5) (medium confidence).
Changes in Global Surface Temperatures
Key Snip Synopsis
- Temperatures have risen a a best estimate of 1.07°C since 1850 due to man-made causes.
- The sea rise between 1971 and 2006 was 1.3 mm per year. That’s 0.0511811 inches per year.
- The sea rise between 2006 and 2018 was 3.7 mm per year. That’s 0.145669 inches per year.
- Under all emissions scenarios, global warming of 1.5°C and 2°C will be exceeded during the 21st century.
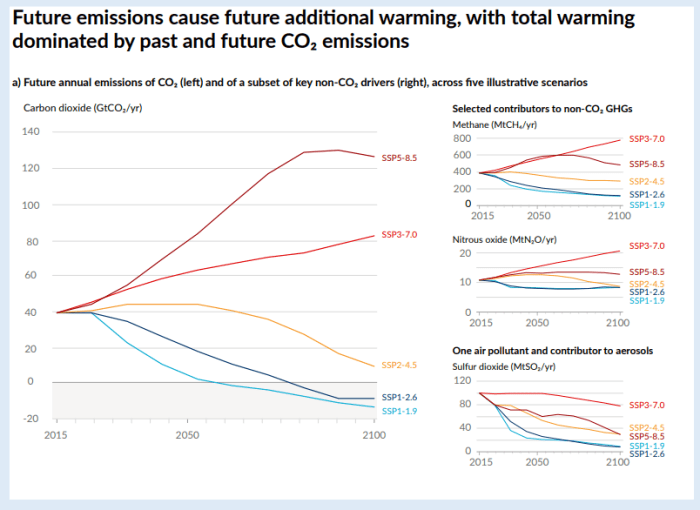
Future Emissions Projections
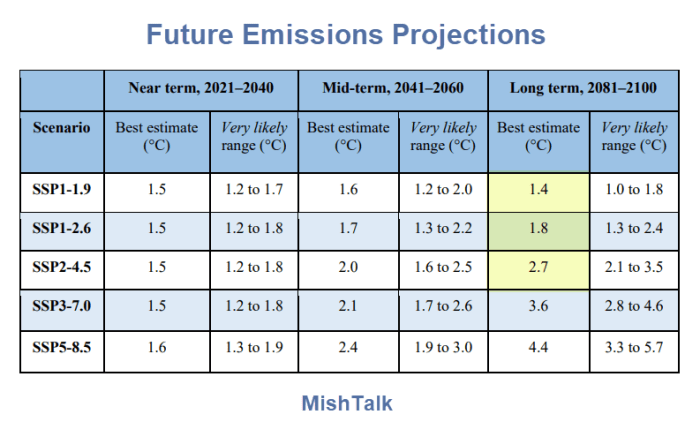
Future Emissions Projections Table
Future Emissions “What If?”
- If by some miracle we follow the SSP 1-1.9 row in the table, the current best estimate is temperatures will rise anyway until 2100 by 1.4 degrees.
- According to row SSP 2-4.5, if there is no further progress at all until 2050, temperatures would only rise an additional 1.3 degrees vs SSP 1-1.9.
- Under SSP 1-2.6, there’s a mere 0.4 degrees difference from a very radical effort to cut emissions to 0 by 2050!
Media Can’t Handle the Climate Truth
Please consider the WSJ Op-Ed Media Can’t Handle the Climate Truth
After 41 years of promoting a fuzzy and unsatisfying estimate of how much warming might result from a doubling of atmospheric CO2, the world’s climate science arbiter has finally offered the first real improvement in the history of modern climate science.
The U.N. panel now says the dire emissions scenario it promoted for two decades should be regarded as highly unlikely, with more plausible projections at least a third lower.
The report also notes, as the press never does, the full impact of these emissions won’t be manifested until decades, even a century, later. The ultimate likely worst-case effect of a doubling of CO2 might be 4 degrees, but the best estimate of the “transient climate response” this century is about 2.7 degrees, or 1.6 degrees on top of the warming experienced since the start of the industrial age.
You might not wish this on your least-favorite planet, but compare it with media coverage of the U.S. National Climate Assessment in 2018, which paraded as a nearly foregone conclusion a temperature increase of 6.1 degrees.
This week’s massive rainstorm in the Northeast reflexively was described as a consequence of climate change. Never mind that heavy rains always happened and, in any case, climate policy can’t be a solution for a New York City storm-drain system designed not to withstand a five-year storm, let alone a 100-year storm.
Or take the U.S. government’s claim that July was the hottest month on record. Unmentioned in any news report that I could find, the margin of error in this measurement was 10 times as large as the purported difference over the previously claimed hottest month of July 2016.
Code Red For Humanity?
The words most quoted in the press weren’t found in the U.N. report or even its executive summary. They were the claims of a pair of U.N. officials that the report heralded a “code red for humanity” and, even more devoid of meaning, that “no one is safe” from a warming planet.
Even if you believe the science, the one thing neither the media nor any panels like to discuss is costs.
Economically Crazy
Stunningly Absurd Green New Deal
On February 7 2020, AOC unleashed her Stunningly Absurd “New Green Deal”.
- Upgrade all existing buildings in the US
- 100% clean power
- Support family farms
- Universal access to healthy food
- Zero-emission vehicle infrastructure
- Remove greenhouse gasses form the atmosphere
- Eliminate unfair competition
- Affordable access to electricity
- Create high-quality union jobs that pay prevailing wages
- Guaranteeing a job with a family sustaining wage, adequate family and medical leave, paid vacations, and retirement security to all people of the United States
A think-tank led by a former Congressional Budget Office director has come up with a price of the New Green Deal: AOC’s Green New Deal Price Tag of $51 to $93 Trillion vs. Cost of Doing Nothing
More $90 Trillion Solutions
In 2015, Business Insider noted A Plan Is Floating Around Davos To Spend $90 Trillion Redesigning All The Cities So They Don’t Need Cars
The $90 trillion proposal came from former US vice president Al Gore, former president of Mexico Felipe Calderon, and their colleagues on The Global Commission on the Economy and Climate.
50 Years of Dire Climate Forecasts
Let’s review 50 Years of Dire Climate Forecasts and What Actually Happened
- 1967 Salt Lake Tribune: Dire Famine Forecast by 1975, Already Too Late
- 1969 NYT: “Unless we are extremely lucky, everyone will disappear in a cloud of blue steam in 20 years. The situation will get worse unless we change our behavior.“
- 1970 Boston Globe: Scientist Predicts New Ice Age by 21st Century said James P. Lodge, a scientist at the National Center for Atmospheric Research.
- 1971 Washington Post: Disastrous New Ice Age Coming says S.I. Rasool at NASA.
- 1972 Brown University Letter to President Nixon: Warning on Global Cooling
- 1974 The Guardian: Space Satellites Show Ice Age Coming Fast
- 1974 Time Magazine: Another Ice Age “Telling signs everywhere. Since the 1940s mean global temperatures have dropped 2.7 degrees F.”
- 1974 “Ozone Depletion a Great Peril to Life” University of Michigan Scientist
- 1976 NYT The Cooling: University of Wisconsin climatologist Stephen Schneider laments about the “deaf ear his warnings received.”
- 1988 Agence France Press: Maldives will be Completely Under Water in 30 Years.
- 1989 Associated Press: UN Official Says Rising Seas to ‘Obliterate Nations’ by 2000.
- 1989 Salon: New York City’s West Side Highway underwater by 2019 said Jim Hansen the scientist who lectured Congress in 1988 about the greenhouse effect.
- 2000 The Independent: “Snowfalls are a thing of the past. Our children will not know what snow is,” says senior climate researcher.
- 2004 The Guardian: The Pentagon Tells Bush Climate Change Will Destroy Us. “Britain will be Siberian in less than 20 years,” the Pentagon told Bush.
- 2008 Associate Press: NASA Scientist says “We’re Toast. In 5-10 years the Arctic will be Ice Free”
- 2008 Al Gore: Al Gore warns of ice-free Arctic by 2013.
- 2009 The Independent: Prince Charles says Just 96 Months to Save the World. “The price of capitalism is too high.”
- 2009 The Independent: Gordon Brown says “We have fewer than 50 days to save our planet from catastrophe.”
- 2013 The Guardian: The Arctic will be Ice Free in Two Years. “The release of a 50 gigaton of methane pulse” will destabilize the planet.
- 2013 The Guardian: US Navy Predicts Ice Free Arctic by 2016. “The US Navy’s department of Oceanography uses complex modeling to makes its forecast more accurate than others.
- 2014 John Kerry: “We have 500 days to Avoid Climate Chaos” discussed Sec of State John Kerry and French Foreign Minister Laurent Fabious at a joint meeting.
*
Note to readers: Please click the share buttons above or below. Follow us on Instagram, @crg_globalresearch. Forward this article to your email lists. Crosspost on your blog site, internet forums. etc.
All images in this article are from Mish Talk


