Covid-19: Questionable Policies, Manipulated Rules of Data Collection and Reporting. Is It Safe for Students to Return to School?
If COVID Fatalities Were 90.2% Lower, How Would You Feel About Schools Reopening?

Article by
H. Ealy, M. McEvoy, M. Sava, S. Gupta, D. Chong, D. White, J. Nowicki, P. Anderson
***
Key Findings For Data Through July 12th
- According to the CDC, 101 children age 0 to 14 have died from influenza, while 31 children have died from COVID-19.
- No evidence exists to support the theory that children pose a threat to educational professionals in a school or classroom setting, but there is a great deal of evidence to support the safety of in-person education.
- According to the CDC, 131,332 Americans have died from pneumonia and 121,374 from COVID-19 as of July 11th, 2020.
- Had the CDC used its industry standard, Medical Examiners’ and Coroners’ Handbook on Death Registration and Fetal Death Reporting Revision 2003, as it has for all other causes of death for the last 17 years, the COVID-19 fatality count would be approximately 90.2% lower than it currently is.
Abstract
The CDC has instructed hospitals, medical examiners, coroners and physicians to collect and report COVID-19 data by significantly different standards than all other infectious diseases and causes of death.
These new and unnecessary guidelines were instituted by the CDC in private, and without open discussion among qualified professionals that are free from conflicts of interest.
These new and unnecessary guidelines were additionally instituted despite the existence of effective rules for data collection and reporting, successfully used by all hospitals, medical examiners, coroners, and physicians for more than 17 years.
As a result, elected officials have enacted many questionable policies that have injured our country’s economy, our country’s educational system, our country’s mental and emotional health, and the American citizen’s personal expression of Constitutionally-protected rights to participate in our own governance.
***
This paper will present significant evidence to support the position that if the CDC simply employed their 2003 industry standard for data collection and reporting, which has been successfully used nationwide for 17 years; the total fatalities attributed to COVID-19 would be reduced by an estimated 90.2%, and questions would be non-existent regarding schools reopening and whether or not Americans should be allowed to work.
Is It Safe for Students & Teachers to Return to School?
While the current question gripping the nation is, ‘Should schools reopen in the fall?’ The crucial data available through the CDC, but not being actively promoted by the CDC, asks a different question, ‘Should schools have ever closed in the first place?’
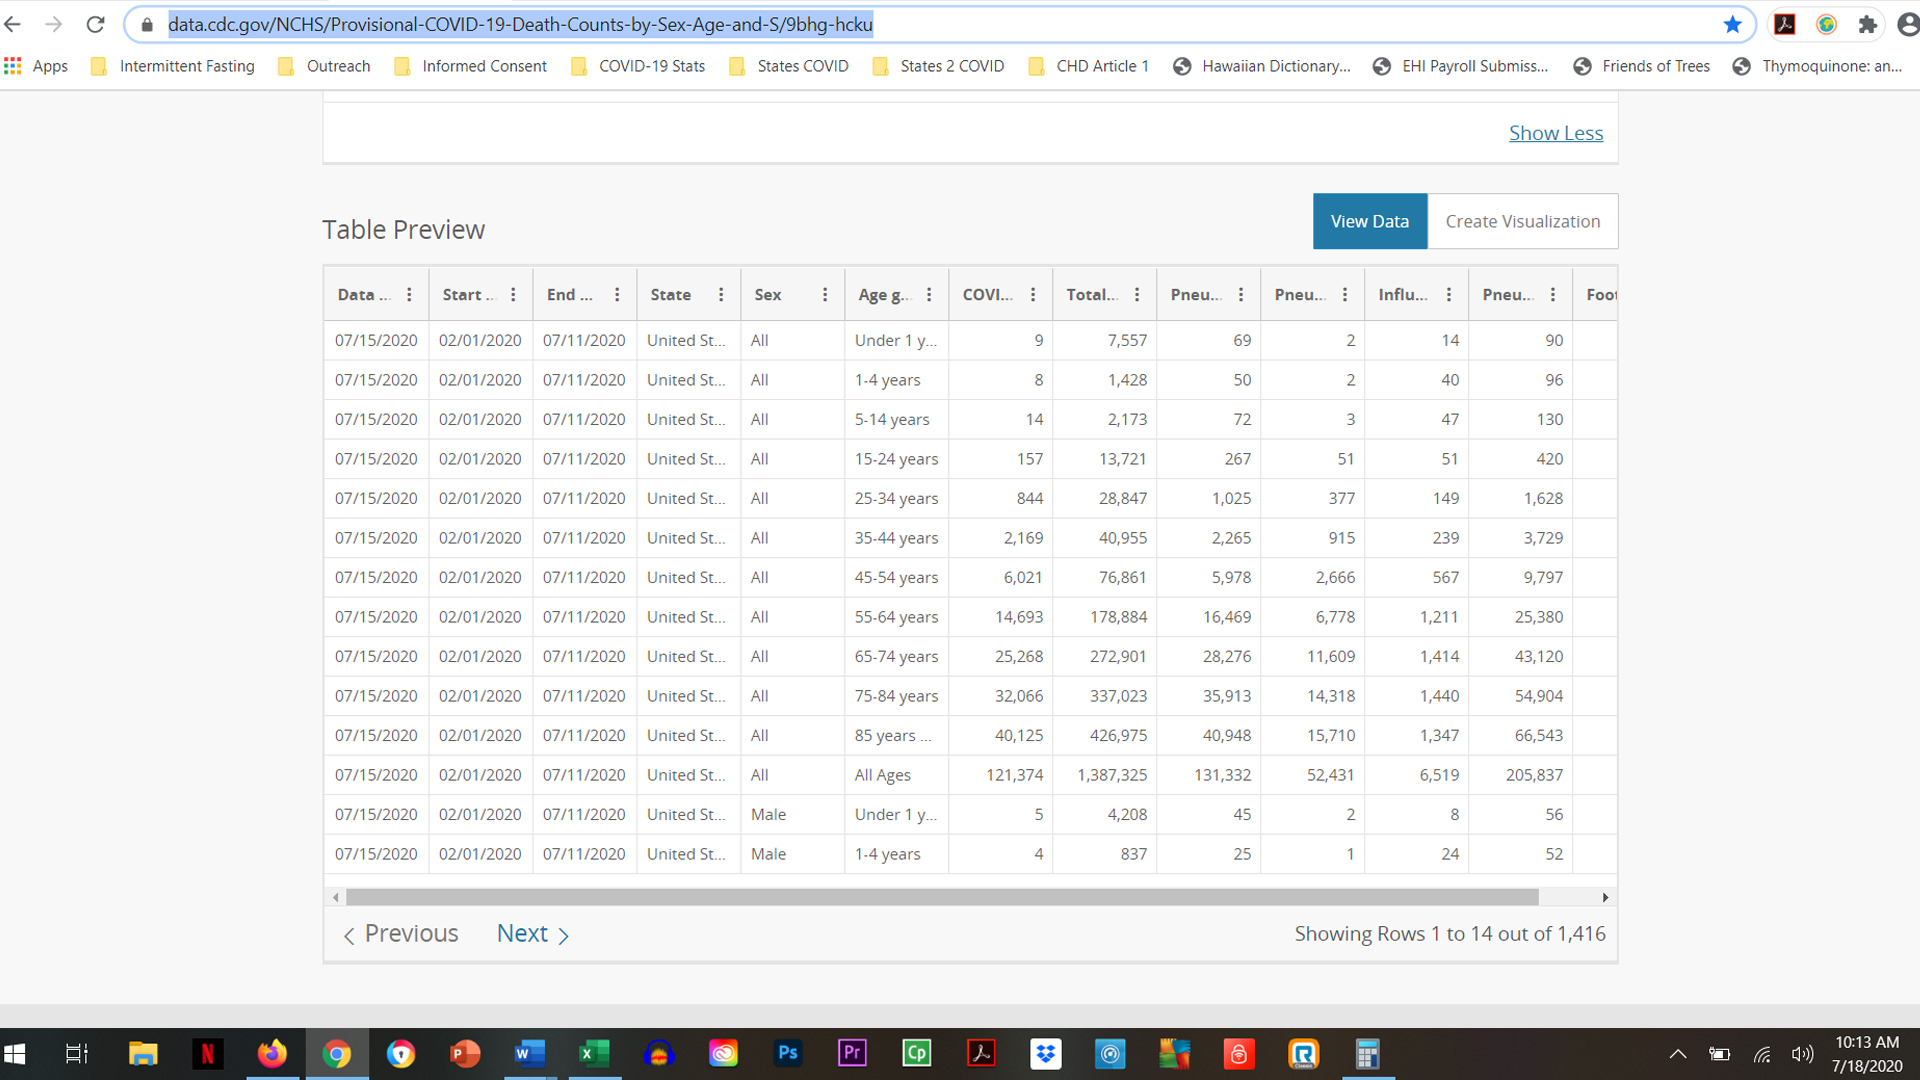
According to the CDC’s Provisional COVID-19 Death Counts By Sex, Age & State, we know the following data from Feb 1, 2020 through July 11th, 2020.1
- Three times as many children in the 0 to 14 age demographic have died from influenza (101) compared to COVID-19 (31).
- In the 0 to 14 age demographic, there have been 11,158 reported fatalities from all causes.
- Thus, COVID-19 fatalities in the 0 to 14 age demographic make up a very small 0.0278% of all fatalities.
There is more data when looking at the 15 to 24 age demographic.
- 41.2% more teens and college age young adults, in the 15 to 24 age demographic, have died from pneumonia (267) compared to COVID-19 (157).
- In the 15 to 24 age demographic, there have been 13,721 reported fatalities from all causes.
- Thus, COVID-19 fatalities in the 15 to 24 age demographic make up only 1.14% of all fatalities.
We would not consider closing in-person educational institutions for typical seasonal flu or pneumonia fatalities, so why did we close them when COVID-19 numbers are even lower?
Some have argued for concern and caution in the 25 to 54 age demographic, which makes logical sense, so let’s look again at the current data available.
- More work force age adults, in the 25 to 54 age demographic, have died from pneumonia (9,268) compared to COVID-19 (9,034).
- In the 25 to 54 age demographic, there have been 146,663 reported fatalities from all causes.
- Thus, COVID-19 fatalities in the 25 to 54 age demographic make up 6.16% of all fatalities. The risk of fatality for COVID-19 is on par with the risk of fatality associated with contracting pneumonia, 6.32% in this age demographic.
As encouraging as this data is, we have concerns regarding data collection and reporting that we will discuss below that potentially lowers current fatality counts by 90.2%. It is very possible that state health departments have been instructed by the CDC to over-count COVID fatalities, cases, and hospitalizations, and we will present that evidence shortly.
As we have demonstrated in our first 2 research articles, ‘Are Children Really Recovering 99.9584% of the Time From COVID-19,’ and ‘COVID-19…Have You Heard? There Is Good News!’ there is a very real concern for Americans over the age 50 and especially over 65 years of age. Risk of fatality increases substantially for Americans over age 50 with at least 1 of the following comorbidities: Hypertension, Diabetes, Elevated Cholesterol, Kidney Disease, Dementia, Heart Disease. For perspective, according to the CDC, is the risk of dying from pneumonia higher than the risk of dying from COVID-19 in the 55 to 64 age demographic?
- Pre-retirement adults, in the 55 to 64 age demographic, had a slightly higher chance of dying from pneumonia (16,469) compared to COVID-19 (14,963).
- In the 55 to 64 age demographic, there have been 178,884 reported fatalities from all causes.
- Since February 1st, fatalities in the 55 to 64 age demographic had a 12% greater risk of dying from pneumonia than COVID-19. COVID-19 fatalities in the 55 to 64 age demographic make up 8.21% of all fatalities and the risk of fatality due to COVID-19 is on par with the risk of fatality associated with contracting pneumonia, 9.21%.
The reported fatalities from the CDC’s Provisional COVID-19 Death Counts by Sex, Age & State webpage:
- Include ‘Probable’ fatalities, unconfirmed by testing, for COVID but not for influenza or pneumonia;
- Does not have accompanying data to detail how many of the fatalities had significant underlying, pre-existing, or comorbid medical conditions;
- Does not have accompanying data to determine if any of the fatalities were treated in a hospital setting and if the subsequent fatality was a result of the treatment.
What this data does reveal, however, is that there is no more significant risk of fatality from contracting the SARS-CoV-2 virus than from contracting influenza for children & teens. It also reveals that there is no more significant risk of fatality from contracting the SARS-CoV-2 virus than there is for developing pneumonia for teens & young adults.
We would not consider prohibiting in-person education when presented with infection rates and medical conditions at these rates, so why are we considering doing it for an infection that poses even less of a risk?
What this data reveals for adults working with children, teens, and young adults is that COVID-19 has a lower risk of fatality than pneumonia and the data suggests that other options should be created for both parents and educational professionals to allow them to choose which style of education they are currently comfortable with (1) traditional in-person education; (2) hybrid online/in-person education; or (3) virtual online education.
There are many questions that need to be addressed with the current situation.
Should each school district give parents and professionals options for in-person education, hybrid education, and/or online education this fall?
Should parents and professionals be allowed to decide where their comfort level is, and act accordingly given the data presented?
Or, should in-person students and professionals be forced to adhere to guidelines from the CDC that not only compromise the educational experience, but also place undue, unrealistic burdens upon them for something with a lower risk than pneumonia for all and influenza for the 0 to 14 age demographic?
We leave these questions for each American to answer.
More Scientific Evidence that It’s Safe for Children to Go Back to School
A genetic project in Iceland revealed interesting findings about children infecting adults.
“Children under 10 are less likely to get infected than adults and if they get infected, they are less likely to get seriously ill. What is interesting is that even if children do get infected, they are less likely to transmit the disease to others than adults. We have not found a single instance of a child infecting parents.”2 See this
Sweden kept schools open with no demonstrative adverse impact upon children in school settings compared to Finland that elected to close in-person education.
“Sweden’s decision to keep schools open during the pandemic resulted in no higher rate of infection among its schoolchildren than in neighboring Finland, where schools did temporarily close, their public health agencies said in a joint report…In conclusion, (the) closure or not of schools had no measurable direct impact on the number of laboratory confirmed cases in school-aged children in Finland or Sweden.” 3 See this
A German study found that children are unlikely vectors of COVID-19.
“Prof Reinhard Berner, the head of pediatric medicine at Dresden University Hospital and leader of the study, said the results suggested the virus does not spread easily in schools. “It is rather the opposite,” Prof Berner told a press conference. “Children act more as a brake on infection. Not every infection that reaches them is passed on.” The study tested 2,045 children and teachers at 13 schools — including some where there have been cases of the virus.” 4 See this
No evidence of children infecting teachers in Australia.
“Our investigation found no evidence of children infecting teachers…In contrast to influenza, data from both virus and antibody testing to date suggest that children are not the primary drivers of COVID-19 spread in schools or in the community.” 5 See this
School environments are low risk and in-person education resuming should begin.
“Our report includes both the primary and secondary school setting, with no transmission in either setting. The limited evidence of transmission in school settings supports the re-opening of schools as part of the easing of current restrictions. There are no zero risk approaches, but the school environment appears to be low risk.” 6 See this
Infected children do not spread the virus to other children, teachers or administrators.
“The main new finding is that the infected children did not spread the virus to other children or to teachers or other school staff…there was no secondary transmission of the virus to other children at the school, or from children to teachers.” 7 See this
Why Did the CDC Decide to Create Unique Reporting Rules for COVID-19 When Successful Reporting Rules Already Existed?
A double standard exists for how COVID-19 data is collected and reported versus all other infectious diseases and causes of death. Let’s examine three essential data categories; Fatalities, Cases & Hospitalizations for all infectious diseases because there are significant flaws in what constitutes a COVID-19 case, hospitalization and fatality.
On March 24th, the CDC decided to ignore universal data collection and reporting guidelines for fatalities in favor of adopting new guidelines unique to COVID-19. The guidelines the CDC decided against using have been used successfully since 2003.
After all, based upon the July 11th data from the CDC’s Provisional COVID-19 Death Counts by Sex, Age & State webpage, if COVID-19 is an epidemic (122,374 Fatalities), then shouldn’t pneumonia (131,372 Fatalities) also be an epidemic?1
Fatality Data
It is important to note that COVID-19 data is collected and reported by a much different standard than all other infectious diseases and causes of death data. This unique standard for COVID-19 was used, despite the existence of guidelines that have been successfully used since 2003 for data collection across all infective, comorbid, and injurious situations.
This begs the question, if the CDC already has well established guidelines for reporting fatalities then why make up new guidelines for COVID-19?
COVID-19 data is collected and reported based upon the March 24th National Vital Statistics Systems (NVSS) Guidelines and the April 14th CDC adoption of a position paper authored by the Council of State and Territorial Epidemiologists (CSTE). 8,9
However, the data for all other causes of death is based upon the 2003 CDC’s Medical Examiners’ & Coroners’ Handbook on Death Registration and Fetal Death Reporting and the CDC’s Physicians’ Handbook on Medical Certification of Death. 10,11
On March 24th, the NVSS, under the direction of the CDC and National Institute of Health (NIH), instructed physicians, medical examiners, and coroners that COVID-19 would:
- be recorded as the underlying cause of death “more often than not;”
- be recorded as the cause of death listed in Part I of the death certificate even in assumed cases;
- be recorded as the primary cause of death even if the decedent had other chronic comorbidities. All comorbidities for COVID-19 would be listed now in Part II, rather than in Part I as they had been since 2003 for all other causes of death.
March 24th, 2020 – NVSS COVID-19 Alert No. 2
“Will COVID-19 be the underlying cause? The underlying cause depends upon what and where conditions are reported on the death certificate. However, the rules for coding and selection of the underlying cause of death are expected to result in COVID19 being the underlying cause more often than not.”
“Should “COVID-19” be reported on the death certificate only with a confirmed test? COVID-19 should be reported on the death certificate for all decedents where the disease caused or is assumed to have caused or contributed to death. Certifiers should include as much detail as possible based on their knowledge of the case, medical records, laboratory testing, etc. If the decedent had other chronic conditions such as COPD or asthma that may have also contributed, these conditions can be reported in Part II. (See attached Guidance for Certifying COVID-19 Deaths)”
It’s worth noting that Part I of a death certificate is the immediate cause of death listed in sequential order from the official cause on line item (a) to the underlying causes that contributed to death in descending order of importance on line item (d), while Part II is/are the significant conditions NOT relating to the underlying cause(s) in Part I.
As we will demonstrate shortly, comorbid conditions are always listed on Part I of death certificates as causes of death per the 2003 CDC Handbook, so that accurate reporting can be developed. Comorbidities are seldom placed in Part II, as this is typically the place where coroners and medical examiners can list recent infections as underlying factors.
Prior to the March 24th and April 14th decisions, any comorbidities would have been listed in Part I rather than Part II and initiating factors, like recent infections, would have been listed on the last line in Part I or in Part II.
Why does this matter?
This matters because the Part I causes of death are statistically recorded for public health reporting, while Part II does not hold nearly the same statistical significance in reporting. This March 24th NVSS guideline essentially allows COVID-19 to be the cause of death when the actual cause of death should be the comorbidity according to the industry-standard 2003 CDC Handbook. It can be a bit confusing, so we will present an example shortly for clarity.
On April 14th, the CDC in conjunctions with approval from the National Institute of Health (NIH), adopted the CSTE position paper that authorized the following guidelines for data collection and reporting which are completely unique for COVID-19 and had never been done before which:
- allowed for ‘Probable’ cases, hospitalizations, and fatalities [section A5];
- created a pathway for the minimum standards of evidence to be a single cough [section A1];
- created a pathway for completely bypassing laboratory testing in order to classify a COVID-19 case as positive [section A5];
- created a pathway for the minimum standard of evidence necessary for determining a COVID-19 case to be positive as being within 6 feet of a ‘Probable’ case for 10 minutes or traveling to an area with outbreaks [section A3];
- declined to create any methodology for ensuring the same COVID-19 positive person would not be counted multiple times as a new case upon being tested multiple times [section B].
April 14th, 2020 – CDC Adopts CSTE Interim-20-ID-01
Title: Standardized surveillance case definition and national notification for 2019 novel coronavirus disease (COVID-19)
“VII. Case Definition for Case Classification
- Narrative: Description of criteria to determine how a case should be classified.
A1. Clinical Criteria At least two of the following symptoms:
- fever (measured or subjective), chills, rigors, myalgia, headache, sore throat, new olfactory and taste disorder(s) OR
- At least one of the following symptoms: cough, shortness of breath, or difficulty breathing OR
- Severe respiratory illness with at least one of the following:
- Clinical or radiographic evidence of pneumonia, or
- Acute respiratory distress syndrome (ARDS). AND
- No alternative more likely diagnosis
A2. Laboratory Criteria Laboratory evidence using a method approved or authorized by the FDA or designated authority:
Confirmatory laboratory evidence:
- Detection of SARS-CoV-2 RNA in a clinical specimen using a molecular amplification detection test
Presumptive laboratory evidence:
- Detection of specific antigen in a clinical specimen
- Detection of specific antibody in serum, plasma, or whole blood indicative of a new or recent infection*
*serologic methods for diagnosis are currently being defined
A3. Epidemiologic Linkage One or more of the following exposures in the 14 days before onset of symptoms:
- Close contact** with a confirmed or probable case of COVID-19 disease; or
- Close contact** with a person with:
- clinically compatible illness AND
- linkage to a confirmed case of COVID-19 disease.
- Travel to or residence in an area with sustained, ongoing community transmission of SARS-CoV2.
- Member of a risk cohort as defined by public health authorities during an outbreak.
**Close contact is defined as being within 6 feet for at least a period of 10 minutes to 30 minutes or more depending upon the exposure. In healthcare settings, this may be defined as exposures of greater than a few minutes or more. Data are insufficient to precisely define the duration of exposure that constitutes prolonged exposure and thus a close contact.
A4. Vital Records Criteria A death certificate that lists COVID-19 disease or SARS-CoV-2 as a cause of death or a significant condition contributing to death.
A5. Case Classifications
Confirmed:
- Meets confirmatory laboratory evidence.
Probable:
- Meets clinical criteria AND epidemiologic evidence with no confirmatory laboratory testing performed for COVID-19.
- Meets presumptive laboratory evidence AND either clinical criteria OR epidemiologic evidence.
- Meets vital records criteria with no confirmatory laboratory testing performed for COVID19.
- Criteria to distinguish a new case of this disease or condition from reports or notifications which should not be enumerated as a new case for surveillance
- N/A until more virologic data are available”
Additionally, the CSTE position paper gave no definition as to what constitutes a COVID-19 recovery for all state and country health departments to follow.
While the, seemingly independent, CSTE position paper was authored by five accomplished professionals from the Idaho, Alabama, Michigan, Hawaii, and Iowa state health departments; 5 of the 7 Subject Matter Experts who contributed to the position paper were directly employed by the CDC which raises ethical concerns about conflicts of interest.
It stands to reason that each of the professionals who contributed to the CSTE position paper were aware of the existence of the 2003 guidelines for reporting fatalities.Additionally, no subject matter experts from universities, medical examiners, coroners or private industry appear to have been consulted on the production of this highly questionable document.
So, why does all of this matter?
It matters for several reasons:
- The minimum standards defy accepted professional standards for differential diagnosis in medical practice;
- Section A3 empowers contact tracers, who are unlikely to have any medical training, to illegally diagnose patients without even examining them, which is a violation of medical law in every state and constitutes practicing medicine without a license;
- The CSTE position paper opens the door for any fatality to be listed as COVID-19 without any reasonable standard of evidence, while mandating that comorbidities simultaneously be deemphasized and moved to Part II, so as not to appear as a cause of death;
- Simultaneous testing for all other infectious diseases, with similar respiratory symptom profiles like Coccidioidomycosis for Valley Fever, is not required. We therefore have no clinical or statistical means of knowing if a co-infection was present along with a positive finding of the SARS-CoV-2 virus in the differential diagnosis process.
Why was all of this necessary with a successful methodology for physicians, medical examiners, and coroners already in place since 2003?
The CDC’s 2003 Handbook suggests that COVID-19 should be listed either at the bottom of Part I or in Part II of a death certificate, rather than as the top line item in Part I, despite Dr. Fauci’s describing in multiple press interviews, that medical examiners and coroners would not be doing this, which disregards any knowledge of the March 24th orders by the NVSS to do so.
Let’s review what would have happened had the CDC decided to use their 2003 Handbook rather than adopting new rules for COVID-19 reporting.
2003 – CDC Medical Examiners’ and Coroners’ Handbook on Death Registration
“Because statistical data derived from death certificates can be no more accurate than the information provided on the certificate, it is very important that all persons concerned with the registration of deaths strive not only for complete registration, but also for accuracy and promptness in reporting these events.”.
“The principal responsibility of the medical examiner or coroner in death registration is to complete the medical part of the death certificate.”
“The cause-of-death section consists of two parts. Part I is for reporting a chain of events leading directly to death, with the immediate cause of death (the final disease, injury, or complication directly causing death) online (a) and the underlying cause of death (the disease or injury that initiated the chain of events [SARS-CoV-2 in this case] that led directly and inevitably to death) on the lowest used line. Part II is for reporting all other significant diseases, conditions, or injuries that contributed to death but which did not result in the underlying cause of death given in Part I.”
Under these guidelines, the highest COVID-19 could be listed in the presence of an established comorbidity would be Part I, line item (d) or lower, or in Part II.
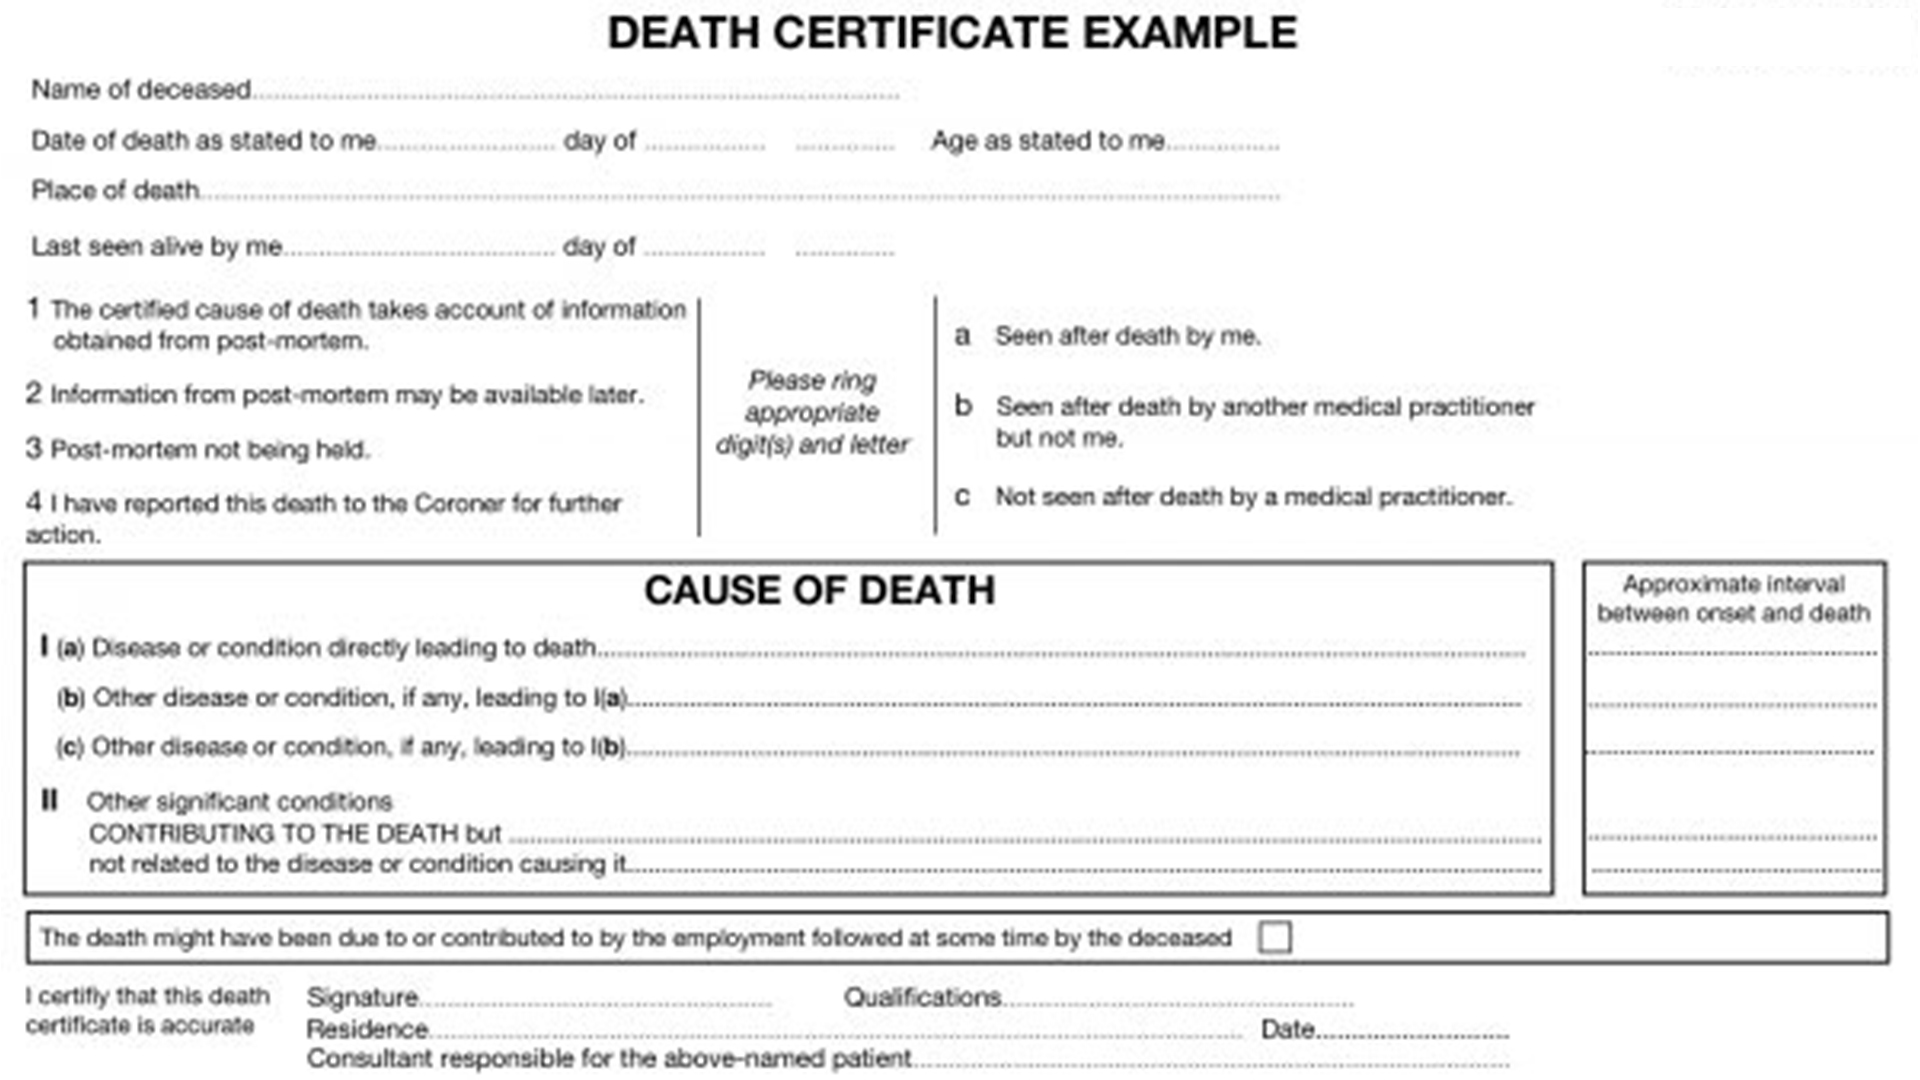
“The cause-of-death information should be the medical examiner’s or coroner’s best medical OPINION. Report each disease, abnormality, in-jury, or poisoning that the medical examiner or coroner believe adversely affected the decedent.”
The ability for medical examiners and coroners to register their best medical opinion was neutered by the March 24th NVSS guidelines.
“If an organ system failure (such as congestive heart failure, hepatic failure, renal failure, or respiratory failure) is listed as a cause of death, always report its etiology on the line(s) beneath it (for example, renal failure due to Type I diabetes mellitus or renal failure due to ethylene glycol poisoning).”
Based upon the 2003 CDC Handbook, Part I for COVID-19 fatalities should contain any comorbidities first. Under these guidelines, COVID-19 would only be listed as a cause of death in Part I if there were no comorbidities and therefore the fatality counts for COVID-19 would be much lower than they currently are.
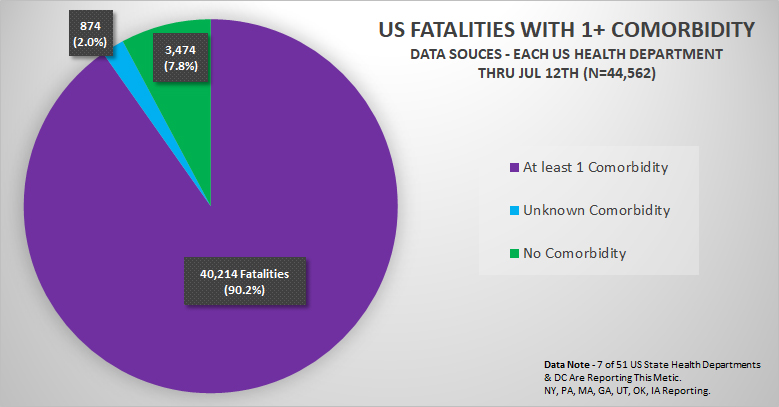
Here is the comorbidity data we have compiled from the only 7 states currently publishing this data in a manner that can be analyzed statistically. Note that 90.2% of fatalities had at least 1 comorbidity and therefore these fatalities would not be counted as COVID-19 fatalities under the 2003 CDC Handbook, but instead are counted based upon the NVSS guidelines and CSTE position paper adopted by the CDC on March 24th and April 14th respectively.
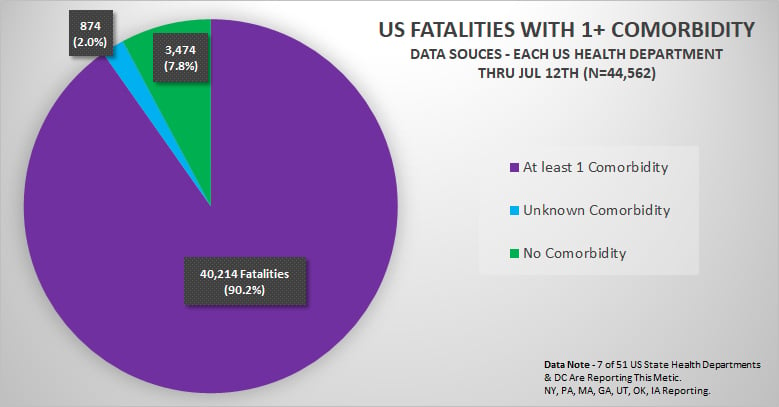
Keep in mind that while the number of fatalities with published comorbidity data is significant (N=44,562), we were unable to obtain comorbidity information on all fatalities from all states because the majority of states have not been publishing this data, if they are collecting it at all.
If each state were publishing comorbidity data, and if each state used the CDC’s 2003 Revision Handbook as they do for all other death certificates, the actual COVID-19 fatality totals would be approximately 90.2% LOWER than they currently are based upon an extrapolation of the data that is available.
2003 – CDC Medical Examiners’ and Coroners’ Handbook on Death Registration [continued]
“Only one cause is to be entered on each line of Part I. Additional lines should be added between the printed lines when necessary. For each cause, indicate in the space provided the approximate interval between the date of onset (not necessarily the date of diagnosis) and the date of death. For clarity, do not use parenthetical statements and abbreviations when reporting the cause of death. The underlying cause of death should be entered on the LOWEST LINE USED IN PART I. The underlying cause of death is the disease or injury that started the sequence of events leading directly to death or the circumstances of the accident or violence that produced the fatal injury. In the case of a violent death, the form of external violence or accident is antecedent to an injury entered, although the two events may be almost simultaneous.”
These clear guidelines from the CDC’s 2003 Handbook state that the highest COVID-19 would be able to be placed for comorbid conditions is on the lowest line in Part I without the March 24th NVSS guidelines and April 14th CSTE position paper. This means that while the SARS-CoV-2 virus may have initiated the process of death, the cause was actually the comorbidity as it should always be.
Additionally…
Without the March 24th NVSS guidelines or the April 14th CSTE position paper adoption, COVID-19 would NOT be allowed to be listed on a death certificate at all WITHOUT A POSITIVE LAB TEST or confirmatory pathologic autopsy findings.
Let’s take a look at how different the cause of death reporting can be for similar situations.
If we have a person who died from renal failure due to type 1 diabetes mellitus, but in scenario 1 the initiating factor was the H1N1 influenza virus while in scenario 2 the initiating factor was the SARS-CoV-2 virus, how would that look?
Here are 2 visuals of just how different these 2 very similar situations are to be recorded based upon March 24th NVSS guidelines.
Scenario 1 – H1N1 Influenza as Initiating Factor

Scenario 2 – COVID-19 as Initiating Factor
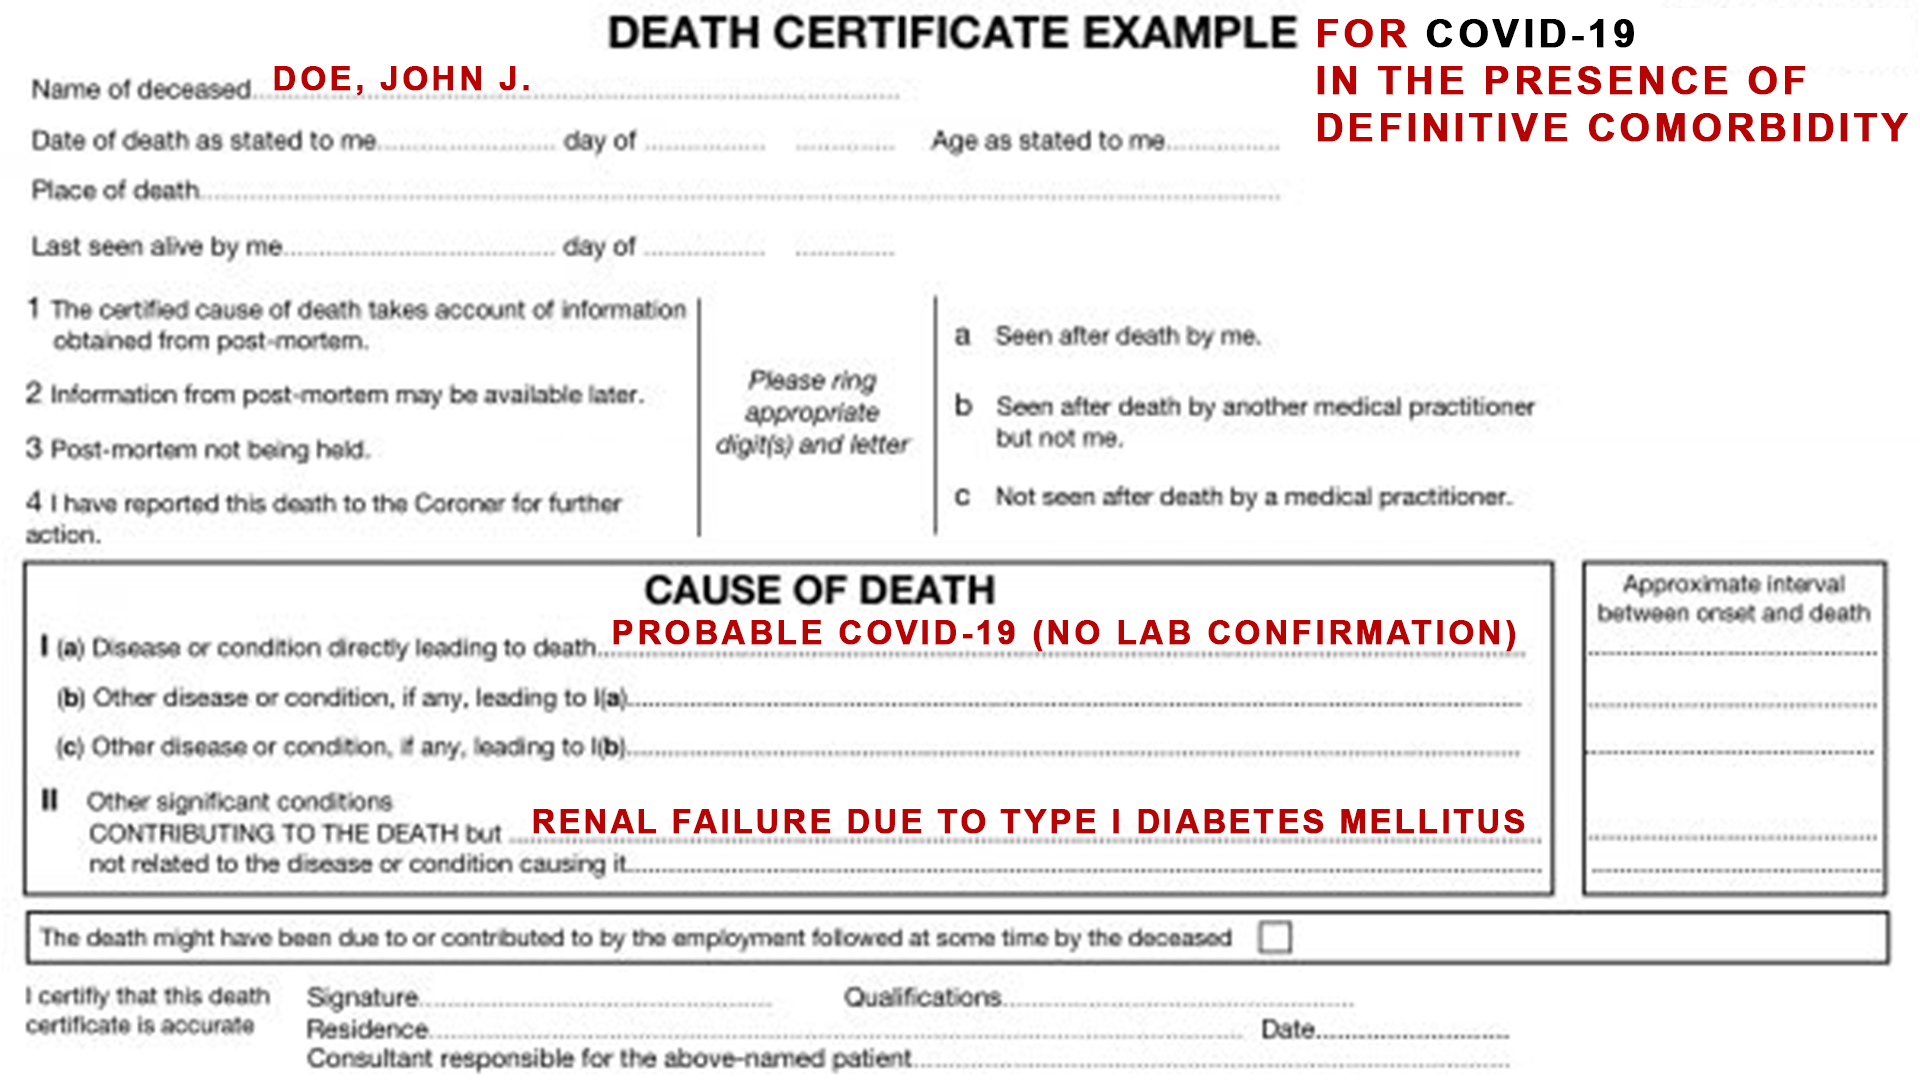
As you can see, these similar situations are reported dramatically different. As a result, the statistical reporting for fatalities will be dramatically different as well, for all people with known comorbidities, which makes up approximately 90.2% of all reported fatalities due to COVID-19 according to the US State Health Departments reporting this data.
Why is all of this important?
The CDC knew in early March that the vast majority of fatalities would be in people over 60 with comorbidities according to Dr. Nancy Messonnier, director of the CDC’s National Center for Immunization and Respiratory Diseases and reported by CNBC on March 9th, 2020.6
“This seems to be a disease that affects adults and most seriously older adults. Starting at age 60, there is an increasing risk of disease and the risk increases with age. People with diabetes, heart disease, lung disease and other serious underlying conditions are more likely to develop “serious outcomes, including death.”
Why would the CDC adopt new rules for reporting fatalities when they already had successful guidelines?
Was the CDC and Dr. Fauci, the head of the NIAID (a division of the NIH), aware of the potential implications that adopting these guidelines would create in terms of fatality reporting?
And perhaps the most important question of them all… Is SARS-CoV-2 a naturally evolved microorganism or is it the result of gain of function experiments?
These are questions Americans deserve answers to, for hopefully obvious reasons.
Why does this matter for schools reopening?
The fatality data being reporting has clearly been inflated in multiple ways due to the adoption of recording and reporting rules that were unnecessary. As a result, this has greatly skewed public perception of this crisis, cost more than 50 million Americans their jobs, and created a tremendous amount of undue fear regarding the SARS-CoV-2 virus.
Even with the March 24th NVSS guidelines and the April 14th adoption of the CSTE position paper, COVID-19 has a lower risk of fatality than pneumonia in all age demographics and a lower risk of fatality than influenza in the 0 to 14 age demographic according to the CDC.
If the fatality data reporting guidelines inflate COVID-19 fatalities while holding all other causes of death to a different and higher standard, then why are we even considering forcing children to study from home?
That is a question every American must answer for themselves as well.
So Why Are Cases & Hospitalizations Continuing to Rise?
It is important to understand the difference between SARS-CoV-2 and COVID-19. The scientific name of the new strain of coronavirus is SARS-CoV-2. After much naming instability, the disease caused by this new strain is called Coronavirus Disease 2019 or COVID-19.
Thus, it is important to realize that once testing is done to determine whether a person is positive for SARS-CoV-2, the patient must then have symptoms consistent with COVID-19 before being counted as a COVID case.
Professional medical training and practice dictates that for a person to be diagnosed with an infection, they must have lab evidence of the infection AND symptoms to support the diagnosis.
This distinction is very important as a person can have detectable levels of the SARS-CoV-2 virus and NOT present with any symptoms. This is possible in the case of a person who had contracted the virus as much as 6 weeks prior, gone through natural adaptive immunity processes to defeat the infection, and now has harmless remnant proteins still present in their body.
For example, an individual may test positive for Human Immunodeficiency Virus (HIV) and not have AIDS. Similarly, an individual may test positive for SARS-CoV-2 and not have COVID-19.
In order for a case to be classified as COVID-19 there must be symptoms to support the diagnosis by a licensed professional. Lab testing alone and symptom evaluation alone violates accepted professional standards for differential diagnosis in medical practice.13
In addition to what is stated above, there are several factors to consider regarding why we are seeing increases in cases and hospitalizations in addition to what was stated above:
- The dramatic increase in testing;
- Contact Tracers diagnosing Americans as COVID-19 positive without examination, evidence, or even being required to speak to a patient as allowed for by the CDC’s April 14th adoption of the CSTE’s position paper;
- June 13th CDC changes to hospital guidelines for testing in hospitals that creates the opportunity for the same patient being counted multiple times as a new case;
- Confirmed & Probable COVID-19 hospitalized cases being counted as COVID-19 cases regardless of the reason for their admission into the hospital.
Increases in Testing
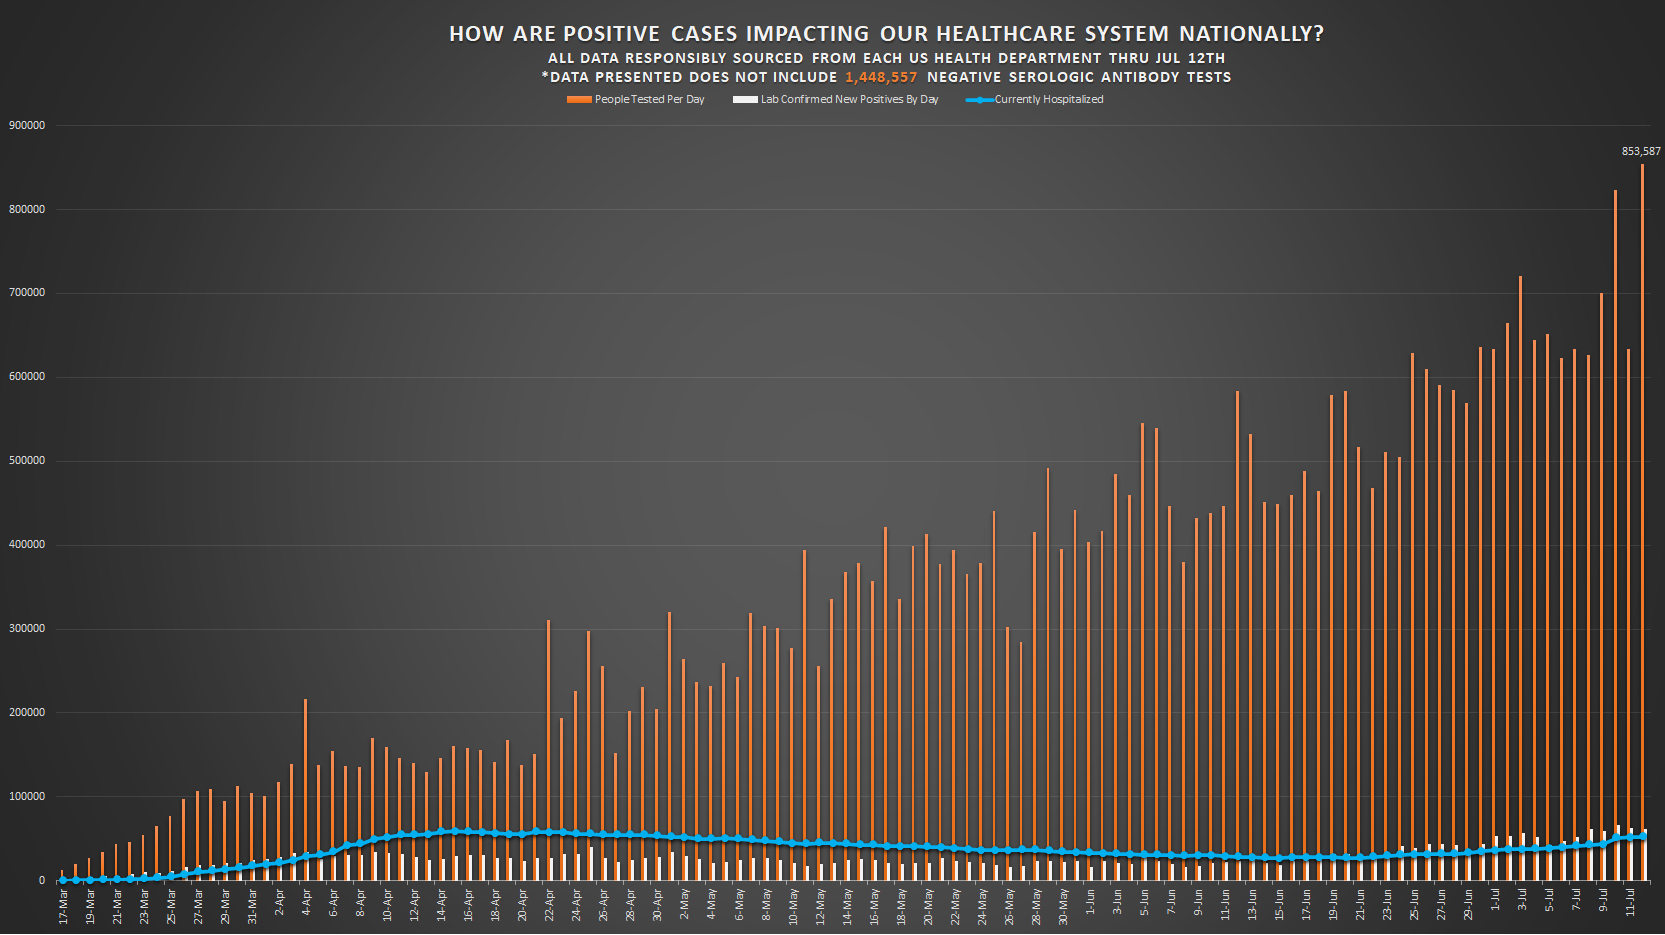
This graph shows how the number of PCR molecular tests processed continues to increase almost daily. Monthly Testing Averages:
- April – 167,477 people tested per day;
- May – 345,361 people tested per day;
- June – 547,480 people tested per day;
- July – 696,396 people tested per day thru July 12th.
More people are testing positive for SARS-CoV-2 per day, and thousands more people are being tested per day. Due to the significant increase in number of people being tested, the overall percentage of people testing positive dropped from a peak of 19.6% on April 12th to 7.8% on July 12th.
Contact Tracers Can Diagnose Without Contact
During our investigation, one of the most concerning pieces of information our team has come across is the empowerment of Contact Tracers (CTs) to diagnose without medical training, medical licensure, medical examination, or even being required to make physical or verbal contact with the prospective patient as allowed for by the CDC’s April 14th adoption of the CSTE position paper [section VII.A3].9
The CDC followed up this dubious authorization with guidance issued on June 17th, 2020.14
“The development and implementation of a robust data management infrastructure will be critical for assigning and managing investigations, linking clients with confirmed and probable COVID-19 to their contacts, and evaluating success and opportunities for improvement in a case investigation and contact tracing program. COVID-19 case investigations will likely be triggered by one of three events:
- A positive SARS-CoV-2 laboratory test or
- A provider report of a confirmed or probable COVID-19 diagnosis or
- Identification of a contact as having COVID-19 through contact tracing
If testing is not available [or declined], symptomatic close contacts should be advised to self-isolate and be managed as a probable case. Self-isolation is recommended for people with probable or confirmed COVID-19 who have mild illness and are able to recover at home.”
What this reveals is that CTs are authorized to diagnose a New COVID-19 case without being medically trained or legally licensed to do so. Even more concerning is that CTs are empowered to do this without needing to examine or take a health history from a prospective patient.
If a person does not answer the call from a CT, then they are able to list that person as a Probable COVID-19 case and report their findings to their state health department for inclusion in reporting data.
This explains why Probable Cases have been rising daily since June 17th despite the dramatic increases in testing.15
Changes In Hospital Testing Protocols & The Inclusion Of COVID-19 Probable Hospitalizations
With the abundant availability of PCR molecular testing, most hospitals in the country have adopted the policy of testing all hospital admissions for the SARS-CoV-2 virus upon admission to the hospital regardless of why that person is being admitted.
People admitted for elective surgeries are required to be tested. People admitted for injuries or accidents are being tested. People in need of care for chronic comorbid conditions are being tested, and so forth.
If a person tests positive for presence of the SARS-CoV-2 virus, regardless of symptom presentation or reason for admission, they are now officially counted as a COVID-19 hospitalized case. This change in policy, never undertaken before, makes it now almost impossible to distinguish between people being admitted for COVID-19 symptoms and people being admitted who simply tested positive for SARS-CoV-2, but are being admitted for reasons other than COVID-19 symptomatology.
As a result, under this methodology of data categorization, hospital numbers have risen and will continue to rise until there are substantive changes to how data is being reported that allows everyone to clearly distinguish between the two vastly different new patient scenarios.
Even worse is the reality that an unacceptable percentage of hospital admissions are ‘Probable’ (‘Suspected’) and not lab confirmed. This is exemplified in this graphic provided by the Massachusetts Department of Public Health on July 12th that shows roughly 70-80% of COVID-19 Hospital Admissions are not lab confirmed. Be aware that the Massachusetts Department of Public Health is doing one of the best jobs in reporting among all state health departments despite the highly questionable CDC guidelines they are being confined to adhere to.
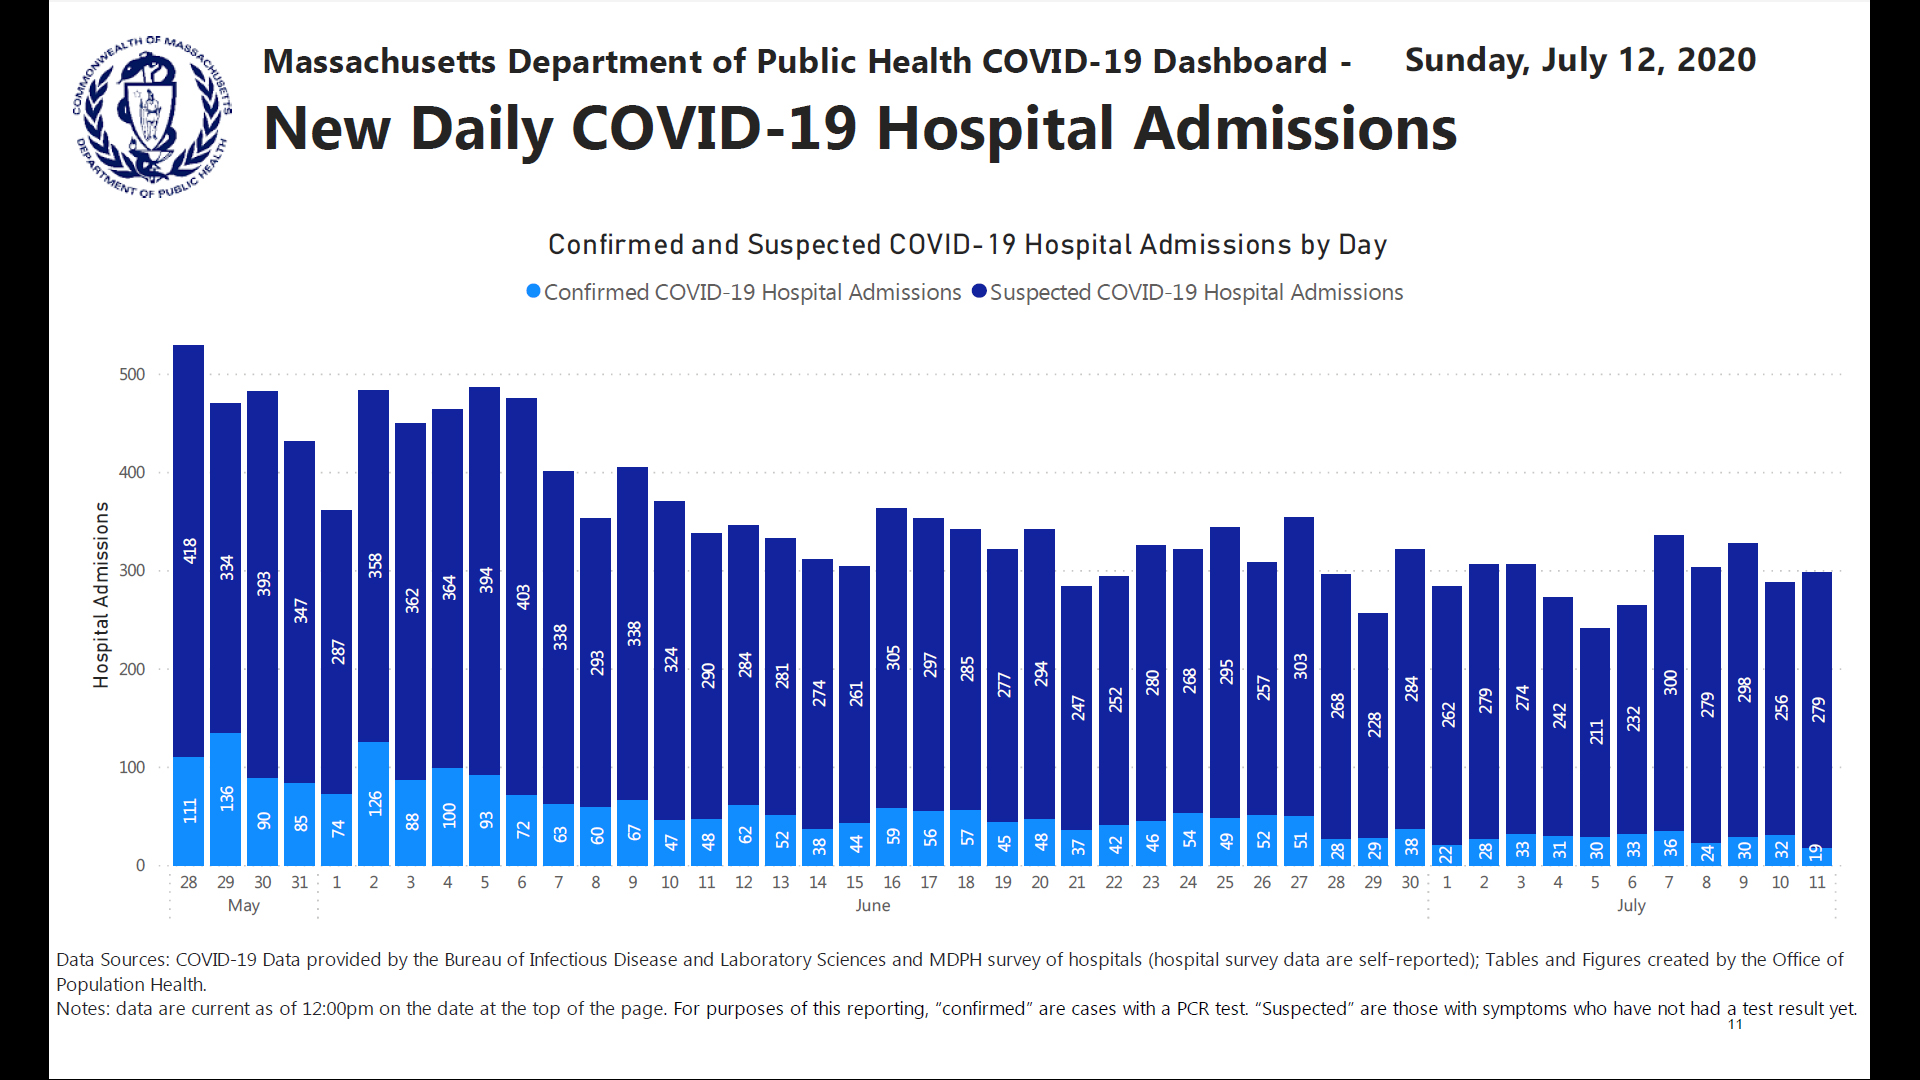
These severe breakdowns in accurate, clear data collection and reporting were initiated by the CDC on March 24th, reinforced again in their adoption of the CSTE’s April 14th position paper, and then reinforced yet again with a June 13th update of hospital testing guidelines for the safe discharge of COVID-19 positive patients.16,17
Per the CDC June 13th Update:
“Recommended testing to determine resolution of infection with SARS-CoV-2
A test-based strategy, which requires serial tests and improvement of symptoms, can be used, as an alternative to a symptom-based or time-based strategy, to determine when a person with SARS-CoV-2 infection no longer requires isolation or work exclusion. This strategy could be considered in three situations: Discontinuation of Transmission-Based Precautions and Disposition of Patients with COVID-19 in Healthcare Settings
Test-based strategy
- Resolution of fever without the use of fever-reducing medications and
- Improvement in respiratory symptoms (e.g., cough, shortness of breath), and
- Negative results of an FDA Emergency Use Authorized COVID-19 molecular assay for detection of SARS-CoV-2 RNA from at least two consecutive respiratory specimens collected ≥24 hours apart (total of two negative specimens)”
What this reveals is that if a person is admitted to a hospital, they must be tested every 24 hours until they produce 2 consecutive negative PCR tests regardless of whether they have the serologic presence of antibodies or there is no serologic detection of the virus in the bloodstream.
Why is this important?
This is important because the PCR test has been reported to be inaccurate 50% of the time it is used according to Dr. Lee as reported in the International Journal of Geriatrics and Rehabilitation published on July 17th, 2020. In this study, up to 30% of PCR tests resulted in false positives and up to 20% resulted in false negatives, which means that PCR may only be accurate for detection 50% of the time it is used.18
The generally accepted medical standard for lab test accuracy is 95% and above, but in a situation like this 70 to 80% would likely be deemed as acceptable by most medical professionals.
Additionally, the mere presence of viral nucleic acids does not necessarily indicate active viral infection nor viral replication. Nucleic acid fragments from a viral entity may exist in patient tissues because of immunological destruction of the virus, which is supposed to happen and potentially occurred several weeks prior to specimen collection. What PCR testing may be discovering is not evidence of a current infection, but rather the remnants of a prior infection that the patient has already recovered from.
Conclusion
Clearly, we have to make significant changes to our case, hospitalization, and fatality definitions, data collection and reporting as a country, if the ultimate goal is accuracy in reporting for policy-level decision making in the best interests of all Americans.
Had the CDC used the well-established and successful methodology for recording COVID-19 related fatalities, as it does for all other causes of death, the fatality counts would be significantly lower.
How much lower?
We may never know. However, when we base our estimates upon the comorbidity data being published by New York, Massachusetts, Georgia, Oklahoma, Utah, Pennsylvania and Iowa the data suggests that accurate fatality rates could drop by approximately 90.2%.
How much would using the Medical Examiners’ and Coroners’ Handbook on Death Registration and Fetal Death Reporting rather than the March 24th NVSS guidelines and the April 14th CSTE position paper completely reshape the way we see COVID-19?
How much would it address the fear of the SARS-CoV-2 virus, and the implications, which so many media outlets have attempted to instilled within us?
And would any objective American have any worry for our children’s safety if they knew that pneumonia and influenza have each claimed more lives in the 0 to 14 age demographic than COVID-19?
We have serious professional and ethical concerns with empowering people with limited medical training to diagnose any medical condition without examining the prospective patient and reviewing a full health history with them as Contact Tracers are doing.
We have serious professional and ethical concerns with hospitals admitting patients as COVID-19 case without definitive evidence.
We have serious professional and ethical concerns with licensed physicians and nurses being required to classify all hospitalizations as COVID-19, regardless of reason for admission, or if the patient tests positive or is suspected to have contracted the SARS-CoV-2 virus. Making this a requirement prevents trained medical professionals from using their best judgment in determining diagnosis.
We have serious professional and ethical concerns with COVID-19 having much lower standards of evidence and much broader categories for inclusion into reports as Probable compared to reporting for all other infectious diseases.
In medicine, we are taught not to guess when we can know, but that basic ethos for safe practice and the sharing of accurate information has not been applied to COVID-19 in our professional opinions.
And we have serious professional and ethical concerns with medical examiners and coroners being required to list COVID-19 on Part I line item (a) as the cause of death in the clear presence of comorbid conditions with verifiable medical history, rather than trusting our healthcare professionals to do the job they are trained to do and have done so well, for so many years.
Medical examiners and coroners play a crucial role in saving lives by producing accurate data licensed healthcare professionals to use in clinical settings.
There is something to be learned in every loss of life. Sadly, what we are learning with COVID-19 is that accuracy in reporting does not matter as much as inflating the data and fanning the flame of fear.
Should American children, educational professionals, small business owners, workers and our country as a whole have to suffer because critical mistakes were made in the adoption of unnecessary new reporting rules?
Should public health officials, with no expertise in public education and economic policy, be given unchecked power to create policies that adversely impact the mental, emotional, and social development of our children, suppress small-business economic opportunity, and threaten to destroy the livelihoods of tens of millions of Americans in the name of safety?
These are questions all Americans deserve an answer to and questions we all must answer for ourselves…our collective future depends upon it.
Mahalo.
***
Updated Probability of Recovery & Age Demographics Data
Probability of Recovery continues to improve for all age demographics from our initial June 21stresearch article.

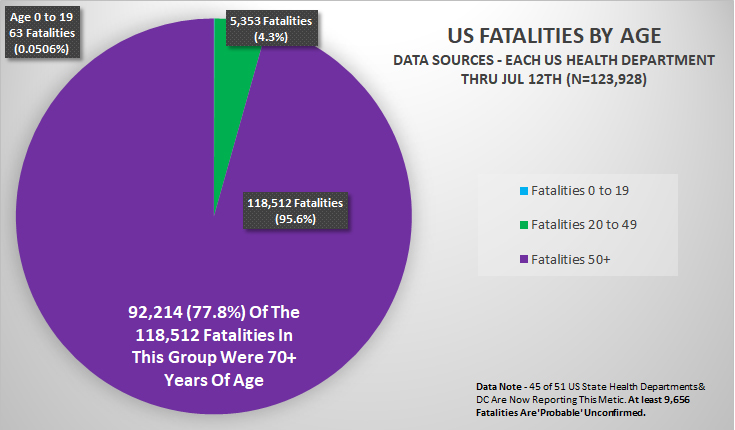
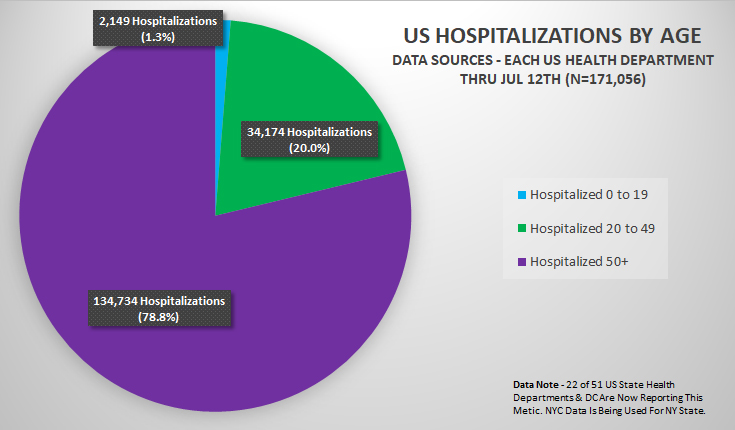
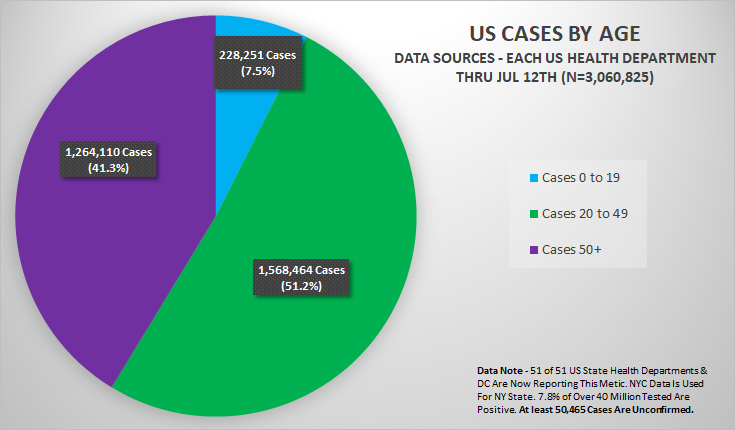
While the relative percentages of Fatalities with 1+ Comorbidity and age demographics for Fatalities, Hospitalizations, and Cases remains relatively unchanged, there has been a slight redistribution of age demographic percentages for cases, as more children in the Age 0 to 19 demographic are being tested for COVID-19.
Funding & Conflict of Interest Statement
This statistical research paper has been developed, composed and published without any funding, and thanks in part to a strictly, 100% volunteer community effort made by a diverse array of qualified professionals who care deeply about children and the health of every American. The authors of this paper confirm no conflicts of interest, financial, political or otherwise.
*
Note to readers: please click the share buttons above or below. Forward this article to your email lists. Crosspost on your blog site, internet forums. etc.
Notes
- CDC: Provisional COVID-19 Death Counts By Sex, Age, & State https://data.cdc.gov/NCHS/Provisional-COVID-19-Death-Counts-by-Sex-Age-and-S/9bhg-hcku
- Highfield, Roger; Coronavirus: Hunting Down COVID-19; Science Museum, 4-27-20: https://www.sciencemuseumgroup.org.uk/blog/hunting-down-covid-19/
- Soderpalm, Helena: Sweden’s health agency says open schools did not spur pandemic spread among children; Reuters: 7-15-20: https://www.reuters.com/article/us-health-coronavirus-sweden-schools-idUSKCN24G2IS
- Huggler, Justin; German Study Finds no Evidence Coronavirus Spreads in Schools; The Telegraph; 7-13-20: https://news.yahoo.com/german-study-finds-no-evidence-164704005.html
- National Centre for Immunisation Research and Surveillance (NCIRS) COVID-19 in schools – the experience in NSW; 26 April 2020: http://ncirs.org.au/sites/default/files/2020-04/NCIRS%20NSW%20Schools%20COVID_Summary_FINAL%20public_26%20April%202020.pdf
- Laura Heavey, Geraldine Casey, Ciara Kelly, David Kelly, Geraldine McDarby; No evidence of secondary transmission of COVID-19 from children attending school in Ireland, 2020; EuroSurveillance, Volume 25, Issue 21, 28/May/2020; https://www.eurosurveillance.org/content/10.2807/1560-7917.ES.2020.25.21.2000903#html_fulltext
- COVID-19 IN PRIMARY SCHOOLS: NO SIGNIFICANT TRANSMISSION AMONG CHILDREN OR FROM STUDENTS TO TEACHERS; 6-23-20; https://www.pasteur.fr/en/press-area/press-documents/covid-19-primary-schools-no-significant-transmission-among-children-students-teachers
- NVSS: National Vital Statistics System COVID-19 Alert No. 2 https://www.cdc.gov/nchs/data/nvss/coronavirus/Alert-2-New-ICD-code-introduced-for-COVID-19-deaths.pdf
- CSTE: Council of State & Territorial Epidemiologists; Standardized surveillance case definition and national notification for 2019 novel coronavirus disease (COVID-19); Interim-20-ID-01; https://cdn.ymaws.com/www.cste.org/resource/resmgr/2020ps/Interim-20-ID-01_COVID-19.pdf
- CDC: Medical Examiners’ and Coroners’ Handbook on Death Registration and Fetal Death Reporting, 2003 Revision https://www.cdc.gov/nchs/data/misc/hb_me.pdf
- CDC: Physicians’ Handbook on Medical Certification of Death, 2003 Revision https://www.cdc.gov/nchs/data/misc/hb_cod.pdf
- Kopecki, Higgins-Dunn, Miller; CDC tells people over 60 or who have chronic illnesses like diabetes to stock up on goods and buckle down for a lengthy stay at home; CNBC, March 9, 2020, https://www.cnbc.com/2020/03/09/many-americans-will-be-exposed-to-coronavirus-through-2021-cdc-says.html
- World Health Organization; Naming the coronavirus disease (COVID-19) and the virus that causes it; https://www.who.int/emergencies/diseases/novel-coronavirus-2019/technical-guidance/naming-the-coronavirus-disease-(covid-2019)-and-the-virus-that-causes-it
- Centers for Disease Control & Prevention (CDC); Data Management for Assigning and Managing Investigations; https://www.cdc.gov/coronavirus/2019-ncov/php/contact-tracing/contact-tracing-plan/data-management.html
- Centers for Disease Control & Prevention (CDC); Cases in the U.S.; https://www.cdc.gov/coronavirus/2019-ncov/cases-updates/cases-in-us.html
- Centers for Disease Control & Prevention (CDC); Overview of Testing for SARS-CoV-2; https://www.cdc.gov/coronavirus/2019-ncov/hcp/testing-overview.html
- Centers for Disease Control & Prevention (CDC); Discontinuation of Transmission-Based Precautions and Disposition of Patients with COVID-19 in Healthcare Settings (Interim Guidance); https://www.cdc.gov/coronavirus/2019-ncov/hcp/disposition-hospitalized-patients.html
- Sin Hang Lee; Testing for SARS-CoV-2 in cellular components by routine nested RT-PCR followed by DNA sequencing; International Journal of Geriatrics and Rehabilitation 2(1):69- 96, July 17, 2020 http://www.int-soc-clin-geriat.com/info/wp-content/uploads/2020/03/Dr.-Lees-paper-on-testing-for-SARS-CoV-2.pdf
State & Territory Health Departments
- Alaska Department of Health & Social Services Coronavirus Response: https://coronavirus-response-alaska-dhss.hub.arcgis.com/
- Alabama’s COVID-19 Data and Surveillance Dashboard: https://alpublichealth.maps.arcgis.com/apps/opsdashboard/index.html#/6d2771faa9da4a2786a509d82c8cf0f7
- https://www.healthy.arkansas.gov/programs-services/topics/novel-coronavirus
- Arkansas Department of Health: https://azdhs.gov/preparedness/epidemiology-disease-control/infectious-disease-epidemiology/covid-19/dashboards/index.php
- California COVID-19 Dashboard: https://public.tableau.com/views/COVID-19PublicDashboard/Covid-19Hospitals?:embed=y&:display_count=no&:showVizHome=no
- Colorado Department of Public Health & Environment, Case Data: https://covid19.colorado.gov/data/case-data
- Connecticut COVID-19 Response: https://portal.ct.gov/Coronavirus
- Government of the District of Columbia, Coronavirus Data: https://coronavirus.dc.gov/page/coronavirus-data
- State of Delaware COVID-19 Data Dashboard: https://myhealthycommunity.dhss.delaware.gov/locations/state
- Florida COVID-19 Response: https://floridahealthcovid19.gov/
- Georgia Department of Public Health: https://dph.georgia.gov/covid-19-daily-status-report
- State of Hawaii Department of Health, Disease Outbreak Division: https://health.hawaii.gov/coronavirusdisease2019/
- Iowa Department of Public Health https://idph.iowa.gov/Emerging-Health-Issues/Novel-Coronavirus
- Idaho Department of Public Health Dashboard: https://public.tableau.com/profile/idaho.division.of.public.health#!/vizhome/DPHIdahoCOVID-19Dashboard_V2/Story1
- Illinois Department of Public Health COVID-19 Statistics: http://www.dph.illinois.gov/covid19/covid19-statistics
- Indiana COVID-19 Dashboard: https://www.coronavirus.in.gov/
- Kansas Department of Health & Environment, COVID-19 Cases in Kansas: https://www.coronavirus.kdheks.gov/160/COVID-19-in-Kansas
- Kentucky Cabinet for Health & Family Services: https://govstatus.egov.com/kycovid19
- Louisiana Department of Health: http://ldh.la.gov/Coronavirus/
- Massachusetts Department of Public Health COVID-19 Dashboard -Dashboard of Public Health Indicators: https://www.mass.gov/info-details/covid-19-response-reporting
- Maryland Department of Health: https://coronavirus.maryland.gov/
- Maine Center for Disease Control & Prevention: https://www.maine.gov/dhhs/mecdc/infectious-disease/epi/airborne/coronavirus/index.shtml
- Michigan Coronavirus Data: https://www.michigan.gov/coronavirus/0,9753,7-406-98163_98173—,00.html
- Minnesota Department of Health: https://www.health.state.mn.us/diseases/coronavirus/situation.html
- Missouri COVID-19 Dashboard: http://mophep.maps.arcgis.com/apps/MapSeries/index.html?appid=8e01a5d8d8bd4b4f85add006f9e14a9d
- Mississippi State Department of Health: https://msdh.ms.gov/msdhsite/_static/14,0,420.html#caseTable
- MONTANA RESPONSE: COVID-19 – Coronavirus – Global, National, and State Information Resources: https://montana.maps.arcgis.com/apps/MapSeries/index.html?appid=7c34f3412536439491adcc2103421d4b
- North Carolina NCDHHS COVID-19 Response: https://covid19.ncdhhs.gov/https://www.health.nd.gov/diseases-conditions/coronavirus/north-dakota-coronavirus-cases
- Coronavirus COVID-19 Nebraska Cases by the Nebraska Department of Health and Human Services (DHHS): https://nebraska.maps.arcgis.com/apps/opsdashboard/index.html#/4213f719a45647bc873ffb58783ffef3
- New Hampshire Department of Health & Human Services: https://www.nh.gov/covid19/
- New Jersey COVID-19 information Hub: https://covid19.nj.gov/#live-updates
- https://cv.nmhealth.org/
- State of Nevada Department of Health & Human Services, Office of Analytics: https://app.powerbigov.us/view?r=eyJrIjoiMjA2ZThiOWUtM2FlNS00MGY5LWFmYjUtNmQwNTQ3Nzg5N2I2IiwidCI6ImU0YTM0MGU2LWI4OWUtNGU2OC04ZWFhLTE1NDRkMjcwMzk4MCJ9
- New York Department of Health, NYSDOH COVID-19 Tracker: https://covid19tracker.health.ny.gov/views/NYS-COVID19-Tracker/NYSDOHCOVID-19Tracker-Map?%3Aembed=yes&%3Atoolbar=no&%3Atabs=n
- New York City Coronavirus Data: https://github.com/nychealth/coronavirus-data
- https://www1.nyc.gov/site/doh/covid/covid-19-data.page
- Ohio Department of Health: https://coronavirus.ohio.gov/wps/portal/gov/covid-19/home
- Oklahoma State Department of Health: https://coronavirus.health.ok.gov/
- Oregon Health Authority: https://govstatus.egov.com/OR-OHA-COVID-19
- COVID-19 Data for Pennsylvania: https://www.health.pa.gov/topics/disease/coronavirus/Pages/Cases.aspx
- Puerto Rico Health Statistics: https://estadisticas.pr/en/covid-19
- Rhode Island COVID-19 Response Data: https://ri-department-of-health-covid-19-data-rihealth.hub.arcgis.com/
- South Carolina Testing Data & Projections (COVID-19): https://scdhec.gov/infectious-diseases/viruses/coronavirus-disease-2019-covid-19/sc-testing-data-projections-covid-19
- South Dakota Department of Health: https://doh.sd.gov/news/Coronavirus.aspx
- Tennessee Department of Health: https://www.tn.gov/health/cedep/ncov.html
- Texas Health & Human Services: https://txdshs.maps.arcgis.com/apps/opsdashboard/index.html#/ed483ecd702b4298ab01e8b9cafc8b83
- Utah Department of Health: COVID-19 Surveillance: https://coronavirus-dashboard.utah.gov/
- Virginia Department of Health: https://public.tableau.com/views/VirginiaCOVID-19Dashboard/VirginiaCOVID-19Dashboard?:embed=yes&:display_count=yes&:showVizHome=no&:toolbar=no
- S Virgin Islands Department of Health: https://doh.vi.gov/
- Vermont Current Activity Dashboard: https://www.healthvermont.gov/response/coronavirus-covid-19/current-activity-vermont
- Washington State Department of Health: https://www.doh.wa.gov/Emergencies/Coronavirus
- Wisconsin Department of Health Services: https://www.dhs.wisconsin.gov/covid-19/data.htm
- West Virginia Health & Human Resources: https://dhhr.wv.gov/COVID-19/Pages/default.aspx
- Wyoming Department of Health: https://health.wyo.gov/publichealth/infectious-disease-epidemiology-unit/disease/novel-coronavirus/covid-19-map-and-statistics/

