


All Global Research articles can be read in 51 languages by activating the Translate Website button below the author’s name (only available in desktop version).
To receive Global Research’s Daily Newsletter (selected articles), click here.
Click the share button above to email/forward this article to your friends and colleagues. Follow us on Instagram and Twitter and subscribe to our Telegram Channel. Feel free to repost and share widely Global Research articles.
Give Truth a Chance. Secure Your Access to Unchained News, Donate to Global Research.
***
In a recent lecture, Nobel Laureate physicist John Clauser exposed how the Intergovernmental Panel on Climate Change (IPCC) models and analyses, which are relied upon by politicians and activists to support claims of a ‘climate crisis’, do not meet basic standards of scientific enquiry. Clauser received his Nobel prize in 2022 for the observational measurement of quantum entanglement and understands well the problem of distinguishing a physical signal from background noise.
Clauser shows that, when corrected for the IPCC’s error prone arithmetic and statistics, the observational data do not support the power imbalance claimed to be responsible for global warming. Furthermore, the outputs of climate models are at variance with the observational record. Clauser discusses the roles of convection, clouds and their variability in providing a negative feedback mechanism, and proposes that this acts as a thermostat that stabilises surface temperatures. Clauser’s conclusion is that claims of a ‘climate crisis’ lack scientific substance and that Net Zero policies are an unnecessary hindrance.
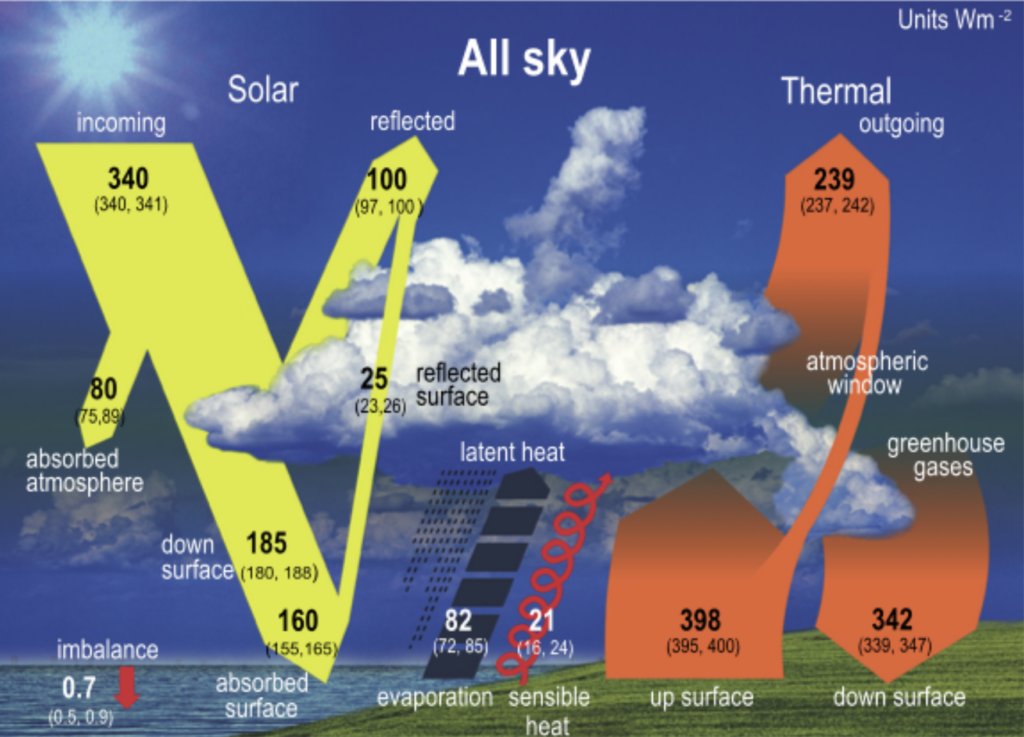
Figure 1. Schematic representation of the global mean energy budget of the Earth. Numbers indicate best estimates for the magnitudes of the globally averaged energy balance components, together with their uncertainty ranges (5%-95% confidence), representing climate conditions at the beginning of the 21st Century. Note that amounts are expressed in terms of power flux (Watts per square metre or W/m2), which equals energy per second per unit area (Joules/s/m2). (Source: IPCC AR6 WG 1 report p.934)
Clauser’s talk is available on YouTube. However, there is merit in reviewing the physics arguments that draw on the observational data about atmospheric energy flows to refute the notion of an anthropogenic global warming (AGW) induced climate crisis.
Energy Flows in the Climate System
It is useful to start with a simplified depiction of the solar energy flow that reaches the Earth, its transformation by the Earth’s climate system and the resulting (mostly thermal) energy flow that leaves the Earth’s atmosphere. This is shown in Figure 1, taken from a recent IPCC report.
The IPCC diagram shows an energy imbalance, being the difference between the incoming visible and UV solar radiation 340 W/m2, less the amount reflected (100 W/m2), less the outgoing infra-red (IR) thermal radiation (239 W/m2). The claimed imbalance at the Top of the Atmosphere is 0.7 W/m2 (give or take 0.2) and the IPCC asserts that this is driving the continuing warming of the climate system.
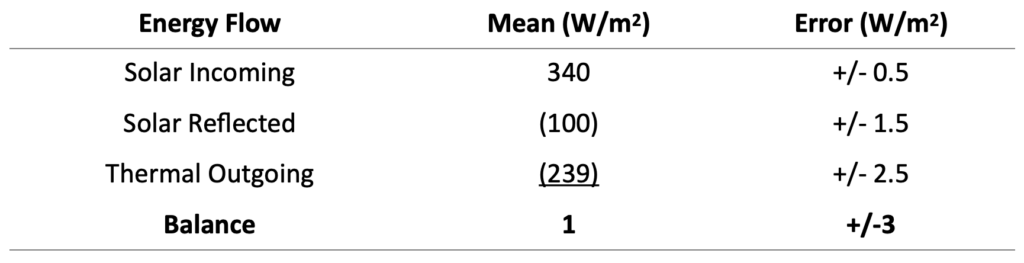
Table. 1. Top of Atmosphere Energy Flows. Energy flows at the top of the Earth’s atmosphere, with their errors as per Figure 1. The balance is calculated from its components.
The radiation measurements necessary for this calculation are carried out at different wavelengths by instruments carried by satellites, and observational errors are inevitable. Combining the uncertainty ranges in the incoming, reflected and outgoing streams shown in Table 1, by using the standard statistical Root Mean Square rule, shows that the error margin in the calculated imbalance is actually 3 W/m2, some 15 times greater than the 0.2 W/m2 error margin claimed by the IPCC. In short, there is no observedenergy imbalance. The claimed imbalance of 0.7 W/m2 is swamped by observational error, and, from a scientific perspective, it is described by Clauser as a “fudge”.
Natural Variability
Importantly, the IPCC treatment understates the natural variability of the solar energy flow that penetrates the climate system. One key element driving this variation is ‘albedo’, the proportion of sunlight that is reflected by clouds or the surface. The extent of cloud cover, which typically covers about two-thirds of the Earth’s surface, is actually quite dynamic, and as a consequence, albedo varies from month to month in a range of 0.275 to 0.305. Clauser estimates that the resulting monthly variation in reflected energy spans the range (95-105 W/m2). Clauser observes that this fluctuating monthly pattern is not well replicated by the Coupled Model Intercomparison Project (CMIP) computer models used by the IPCC, which must therefore be missing key aspects of the physics of clouds.
This is significant because the natural variability introduced to the climate system by variations in clouds and albedo dwarfs the effect of secondary greenhouse gases such as CO2. Moreover, the relative stability of the Earth’s climate system in the face of these swings in the solar energy input indicates that there are negative feedback mechanisms at work.
Surface Heat Flows and the Nature of Atmospheric Equilibrium
Before returning to the subject of clouds, some more comments on the energy flows depicted in Figure 1 are in order. In thermodynamics it is crucial to distinguish between energy and heat. The First Law of Thermodynamics states that energy is conserved. The Second Law of Thermodynamics states that entropy never decreases, and this in turn entails that heat only flows from hotter to colder objects and never the reverse. In order to understand the physics of atmospheric processes it is necessary to take this directionality of heat flows into account. Thus, the ‘greenhouse gases down surface’ energy flux (339-347 W/m2) shown in the IPCC diagram does not actually represent a heat flow; rather it simply acts to counter a portion of the ‘up surface’ energy flux (395-400 W/m2), with the result being that the rate of surface cooling by radiation is determined by the difference (56 +/-5 W/m2). We can use this insight to put the balance of heat flows at the surface into perspective, as shown in Table 2.
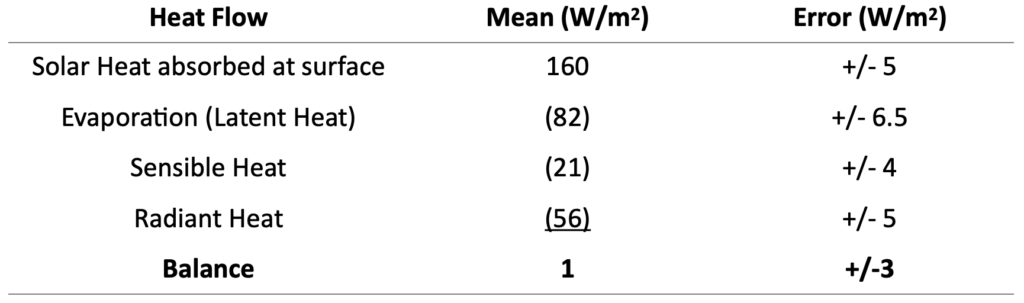
Table. 2. Surface Heat Flows. Downward (upward) heat flows at the Earth’s surface are shown along with their errors. Radiant heat is the net of the surface up and surface down energy fluxes in Figure 1.
The general circulation climate models in use today were inspired by the work of Nobel Prize winning physicist Syukuro Manabe, who in 1967 introduced the paradigm of the atmospheric system as being in a radiative convective equilibrium1. It can be seen from Table 2, that the convective flow of latent and sensible heat is twice as important as radiation in cooling the Earth’s surface. Manabe’s incorporation of convection marked a distinct improvement on the earlier generation of radiative models. One can, however, ask if a predilection for trying to understand atmospheric dynamics purely in terms of radiation, rather than convective heat flows, still persists within the climate modelling community, and whether this is at the root of the continuing inability of climate models to match observation.
Radiative Forcing and Negative Feedbacks
The early work by Manabe, recently confirmed in refined calculations carried out by Happer and van Wjngaarden2, describes the impact of greenhouse gases in terms of ‘radiative forcing’, that is to say, their transient impact on the Top of Atmosphere (ToA) energy balance. Both calculate that the radiative forcing due to a doubling of CO2 leads to around 3 W/m2 reduction in the outgoing thermal radiation in clear skies. Applying the Stefan-Boltzmann Law, according to which black body radiation increases as the fourth power of temperature (measured in degrees Kelvin), tells us that the radiating sources in the atmosphere would need to increase in temperature by about 0.75°C to produce extra compensating radiation. The key question for climate physics is, what is the compensating ground surface temperature response required in order to restore the thermal radiation at the ToA?
The 27 CMIP climate models in use by the IPCC incorporate an Equilibrium Climate Sensitivity (ECS) with a range of 1.8°C to 5.6°C increase in ground surface temperature per doubling of CO23. This is between 2.5 and 7.5 times higher than the temperature response 0.75°C in the atmosphere, implying the presence of some very substantial positive feedback mechanisms incorporated in the CMIP models that multiply the initial forcing.
Clauser makes the general observation, based on Le Chatelier’s principle, that a complex physical system in equilibrium typically contains multiple negative feedback mechanisms that act to oppose rather than amplify forcing and questions the basis of the IPCC’s supposed positive feedbacks.
Indeed, it is far easier to identify negative feedback mechanisms than it is to identify positive feedbacks. Table 3 sets out the obvious negative feedbacks in response to a surface temperature increase of 1°C, that follow by the application of basic physics to the heat flows in Figure 1.
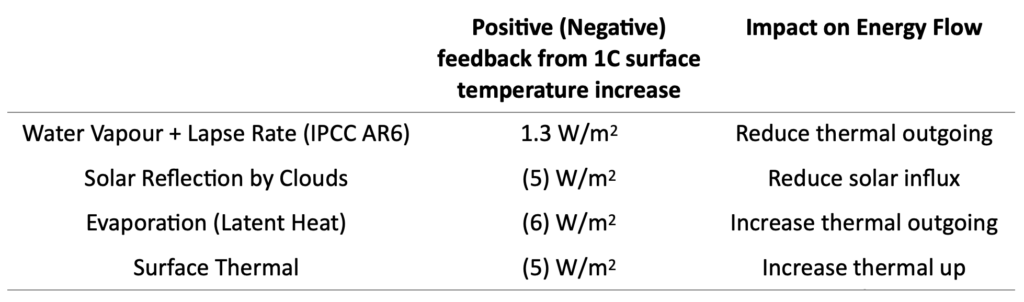
Table. 3. Feedback Responses to Surface Temperature Increase. Solar reflection by clouds estimated at 7% increase in 75 W/m2. Evaporation estimated at 7% increase in 82 W/m2. Surface thermal increase based on Stefan-Boltzmann Law applied to increase in surface temperature from 15°C to 16°C.
The Clausius-Clapeyron relation entails that the saturated water vapour content of air increases by 7% for an increase in temperature of 1°C from the current global average around 15°C. Based on this, the IPCC estimates a positive feedback of 1.3 W/m2 due to increased water vapour content of the atmosphere and the consequent absorption of surface radiation. However, as Clauser points out, the Clausius-Clapeyron relation must also lead to comparable increases in evaporation, cloud formation and rainfall, along with the accompanying transfer of latent heat (of evaporation of water) away from the ground surface. The consequent negative feedbacks act to offset radiative forcing. In particular, (a) the effect of increased solar reflection by clouds has a direct impact on the ToA energy balance, and (b) the physics of convection entails that heated air expands, acquires buoyancy and rises to the Tropopause (at around 11 km altitude), while releasing its extra heat as thermal radiation to space. While some of the surface thermal radiation will be absorbed in the atmosphere, it is manifest from Table 3 that the identified negative feedbacks dwarf the positive feedback calculated by the IPCC.
Clauser points out that the amount of negative feedback from clouds depends not only on their extent, but also on their distribution over the Earth’s surface and on their reflectivity. Most clouds are formed by the strong absorption of sunlight by the oceans, where the cooling impact of reflection from clouds is greater than over land. Taken together, the thermal, convective and cloud negative feedbacks combine to provide a thermostat mechanism that stabilises the temperature of the Earth’s surface against forcing, regardless of whether this originates from variability in solar insolation (for example, due to changes in cloud cover) or from the effect of greenhouse gasses. Clauser estimates a combined negative net feedback strength in the range 7-14 W/m2 per 1°C, consistent with the magnitudes in Table 3.
If we assume an overall net negative feedback of (10) W/m2 per 1°C at the surface, in the middle of Clauser’s range, this would be three times greater than the radiative forcing from a doubling of CO2 in clear skies of 3 W/m2, so the surface temperature increase necessary to offset the radiative forcing would imply an ECS of only 0.3°C. With this level of negative feedback, the ECS range of 1.8°C to 5.6°C used by the IPCC overestimates the effect of CO2 by a factor of between 6 and 19 times.
Equivalently, under this range of negative feedbacks, the ECS range of 1.8°C to 5.6°C would imply that an increase in heat flux from the surface of between 18-56 W/m2 is required to compensate for a mere 3 W/m2 radiative forcing in the atmosphere. Where does the remainder of the heat flux go? The First Law of Thermodynamics entails that this energy cannot disappear, and the Second Law of Thermodynamics entails that heat in the atmosphere can only transfer to a cooler surface (i.e., radiate out to space). The IPCC climate models appear to violate either the First or Second Laws of Thermodynamics, possibly both.
Conclusions
In conclusion, Clauser argues that the negative feedback mechanisms in the Earth’s climate system stabilise temperatures against warming due to increases in radiative forcing. As a corollary, there is no CO2 induced anthropogenic global warming climate crisis. The negative feedbacks similarly serve to stabilise surface temperatures against cooling. Such a thermostatic mechanism that draws on the thermodynamic properties of water can explain how a water-rich planet such as the Earth has been hospitable to life throughout history.
The climate narrative promulgated by the IPCC and its advocates is based on poor statistics, the flawed cherry-picking of data and an incomplete treatment of physical mechanisms, which includes ignoring important negative feedbacks.
An analysis of negative feedbacks implies that the 50% increase in CO2 from pre-industrial times (280 ppm) to the current level (420 ppm) is plausibly the cause of only about 0.15°C of global warming.
A physics explanation of the Earth’s observed historic warming and cooling cycles and the warming observed since the 1970s has to look to the variability induced by the many other natural mechanisms discussed in the climate literature, such as solar cycles, orbital/lunar cycles, cloud variability, ocean cycles, volcanoes, ozone variability, urban heat islands and so on. These are beyond the scope of this note.
*
Note to readers: Please click the share button above. Follow us on Instagram and Twitter and subscribe to our Telegram Channel. Feel free to repost and share widely Global Research articles.
Dr. Rudolph Kalveks is a retired executive. His PhD was in theoretical physics.
Notes
- S. Manabe and R. T. Wetherald, Thermal Equilibrium of the Atmosphere with a Given Distribution of Relative Humidity, J. Atmos. Sci. 24, 241 (1967).
- van Wijngaarden, W.A. and Happer, W., 2020. Dependence of Earth’s Thermal Radiation on Five Most Abundant Greenhouse Gases. arXiv preprint arXiv:2006.03098.
- Zelinka, M.D., Myers, T.A., McCoy, D.T., Po‐Chedley, S., Caldwell, P.M., Ceppi, P., Klein, S.A. and Taylor, K.E., 2020. Causes of higher climate sensitivity in CMIP6 models. Geophysical Research Letters, 47(1), p.e2019GL085782.
Featured image is from TDS