

This year’s Amazon fire season is one of the most serious ever, even though it’s not attracting near the media attention as last year. More than one thousand major fires have already been detected in the rainforest biome this year, with 82 major fires reported in protected areas and Indigenous territories, as of September 10, 2020.
Across the Brazilian Amazon, September has averaged 53 major fires per day (up from 18 in August) says the non-profit MAAP. But according to other sources, there are more than 6,000 hotspots flaring up in just a single day.
With statistics like these apparently diverging so widely among multiple sources, how do we know for sure what, and how much, rainforest is truly burning where? And how exactly are all these fires detected, and what do these numbers mean in reality?
To answer, we have to start in space.
Many satellites circle the Earth daily, some outfitted with tools tailored for fire monitoring. These devices record a variety of data that, when put together with other data sets, give us a multifaceted, well rounded, and increasingly accurate, view of the year’s fires.

The Suomi National Polar-orbiting Partnership (Suomi NPP) satellite operated NASA and NOAA detects fires on earth through infrared sensing. Artist rendering via NASA.
These “near real time” fire detection systems fall into two major types: those sensing heat radiating from the Earth’s surface (“hotspots”) and those detecting aerosol emissions (particles released into the atmosphere from burning biomass). A fire’s presence can also be confirmed in some cases via high-resolution imagery, visual data also gathered by satellites.
An orbiting fire monitoring system basically works like this: a satellite instrument detects fires (either via hotspots or aerosol emissions). These fire alerts are relayed to individual organizations, including NASA or INPE, the Brazilian space agency, who process the incoming information to control for noise in the data (such as heat signals from an industrial blast furnace rather than an Amazon fire). The processed data is then sent to a visualization platform, bringing these satellite-based alerts to decisionmakers or the general public on the Internet. Several of these platforms now exist, including some that launched just this year. Each system analyzes the data somewhat differently — with each assessment valuable in its own way.
Some near real time Amazon fire monitoring platforms, by organization:
- MAAP: The Amazon Real Time Fire Monitoring app uses aerosol detection data (ESA’s Sentinel-5P satellite TROPOMI data) verified with hotspot data and satellite imagery.
- NASA: The U.S. space agency’s new Amazon Dashboard utilizes both hotspot and aerosol fire detection, combined with deforestation and land cover data to determine specifically what type of fires are burning.
- INPE: Brazil’s national space research institute (Programa Queimadas) uses hotspot data from many different satellites for its fire dashboard and fire monitoring program.
- Global Forest Watch (GFW): Uses hotspot analysis (NASA’s Suomi NPP satellite VIIRS data), but primarily focuses on deforestation.
- Infoamazonia: Fire Map uses hotspot data (VIIRS data)
- Greenpeace: The NGO’s new Global Fire Dashboard uses hotspot data (NASA Aqua/Terra satellite MODIS data)
Hotspot data (sometimes called VIIRS or MODIS data) is widely reported in the media, but it can be misleading as a stand-alone metric for Amazon fires because hot spots aren’t well differentiated. Very small, localized events such as a farmer carrying out the yearly burn of corn stubble in a field can generate enough heat to send off an alert. The result is tens of thousands of undifferentiated hotspot alerts, when in reality, there may only be several hundred major deforestation-related fires or forest fires burning.
However, hotspot data is still useful for situational awareness and because it has been collected for decades, so is utilized for making quantitative and location comparisons over time. Also, because it is easily available and straightforward, hot spot data is used by several platforms including Global Forest Watch and Greenpeace’s new Global Fire Dashboard.
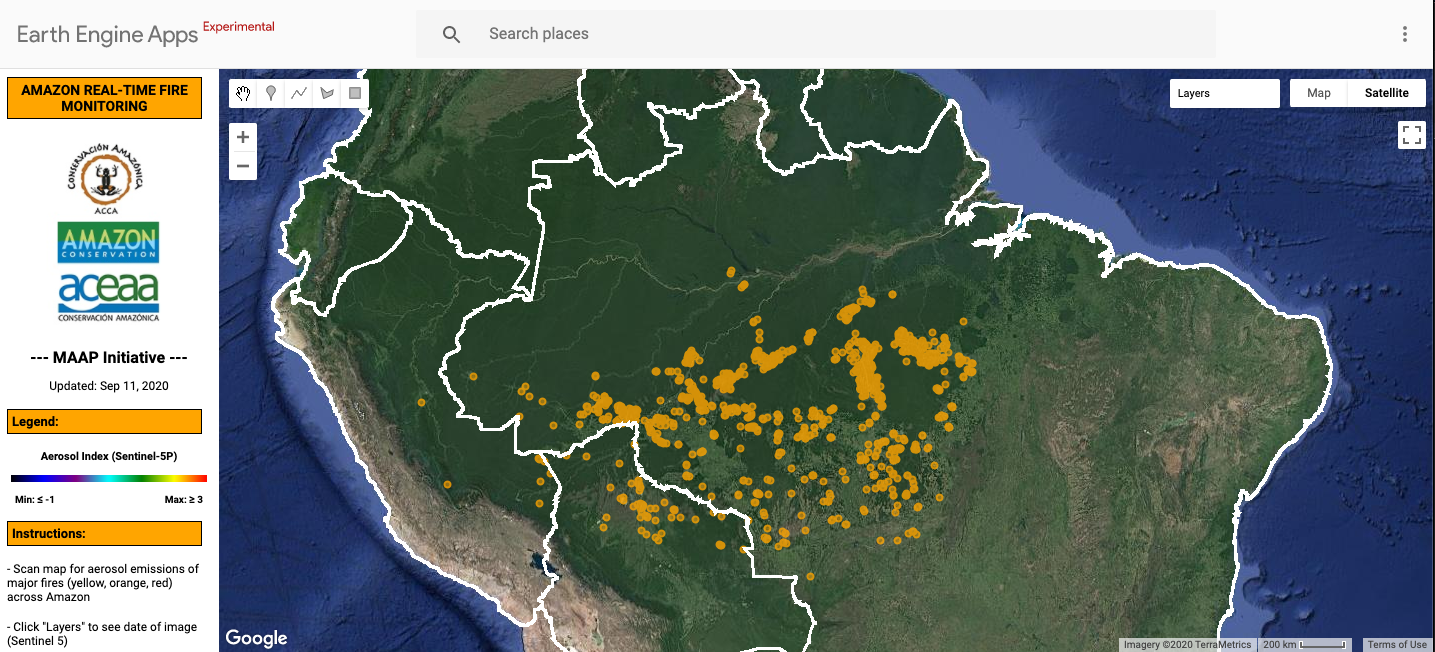
MAAP’s novel Real-time Amazon Fire Monitoring app shows major fires as of Sept 10, 2020. shows major fires as of Sept 10, 2020.
A closer look at MAAP Amazon fire detection
For Amazon fire reporting in 2020, Mongabay has relied heavily on the near-real time fire monitoring data provided by MAAP. MAAP’s novel Real-time Amazon Fire Monitoring app (launched in May 2020) uses a combination of aerosol emissions data, hot spot data, and verification from satellite imagery to report on what it calls “major fires.”
A “major fire” as defined by MAAP is one with an aerosol index of >1 (appearing cyan-green to red on the app). Once an alert is detected, MAAP uses hotspot data to pinpoint the source of aerosol emissions. Using the coordinates from this hotspot source, MAAP analyzes high-resolution satellite images from the Planet Explorer to confirm whether the fire is in a recently deforested area or in a standing forest, and measures the area burned.
Mongabay has also created its own fire dashboard based on MAAP data, which is regularly updated for use in stories.
Major fires in Brazil in 2020
Fire data from MAAP’s Amazon Fire Monitoring App is updated in real time and will include data from after the publication date
Cartography by Willie Shubert in collaboration with InfoAmazonia.org, click this to view.
Importantly, most Amazon fires are not acts of nature. Rather, the majority of fires burn over recently deforested land, with the blazes intentionally set by land grabbers, farmers, and landowners, converting newly cleared forest into pasture and croplands — sometimes as part of a longstanding process of illegally converting public lands to private lands.
Last year, MAAP analyzed archived satellite imagery from Planet Explorer, and found that many of 2019’s fires burned areas deforested earlier that same year, clearing that started just after President Jair Bolsonaro took office. The Bolsonaro administration is known for its policies friendly to the Amazon’s land grabbers.
“The data from MAAP…focuses only on large deforestation events and depend on a fair amount of manual labor, but the data are therefore also highly confident as they use multiple lines of evidence to confirm both the driver (deforestation) and the emissions (aerosols) coming from the fire,” Niels Andela told Mongabay in an email; he is a lecturer in remote sensing at Cardiff University and developed the algorithm behind NASA’s Amazon Dashboard platform.

NASA’s Amazon Dashboard showing hotspot data by fire type on September 10, 2020.
A closer look at NASA’s Amazon Dashboard
NASA’s new Amazon Dashboard, launched August 19, uses a more automated approach than MAAP, and claims some major advances in the way fires are monitored. The platform identifies the number of significant fires burning in the Amazon (instead of just hotspots), what type of fires are burning, and how many new fires started each day — all using automated data collection and computer analysis.
The Amazon Dashboard uses an algorithm to cluster active hotspots into individual fire events (major fires), sometimes composed of hundreds of hotspots. These fire events are also classified as one of four fire types: deforestation, understory fires, small clearing and agricultural fires, and savanna/grassland fires — determined by hotspot data combined with deforestation and landcover data.
“The key advantage of our method is that it is fully automated and thus maps all fires across the region,” Andela said. “Also, we provide much more information than just deforestation fires. For example, our dataset allows for quick identification of all new fires burning across a given region and is intended to support land managers.… Particularly the early identification of understory fires is critical for firefighting efforts.”
“We hope this tool pushes the conversation past some of the confusion surrounding the 2019 fire season,” Doug Morton of NASA’s Goddard Space Flight Center, who helped develop the dashboard, said. “Satellites detect large numbers of fires in South America every year, but not all of these fires are of equal importance.”
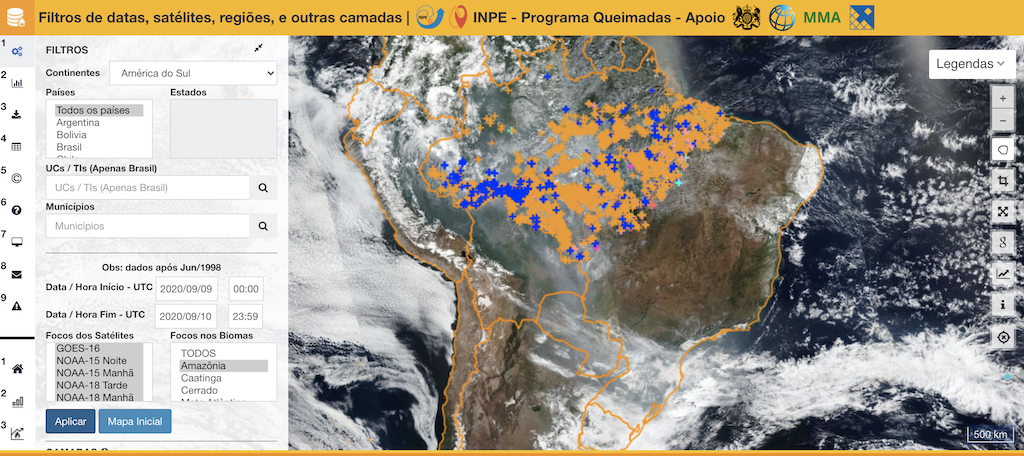
Hotspot alerts are available in the INPE fire monitoring platform (Programa Queimadas) from many different satellites. Here, Amazon hotspot data from September 10, 2020 from all satellites are shown. A menu on the left allows the user to select time, location, satellites, etc.
A closer look at INPE’s fire monitoring program
Brazil’s national space research institute, INPE, uses hotspot data from 13 different satellites to compile its Amazon fire dashboard and fire monitoring program (Programa Queimadas) and filters this data using its own algorithms.
“We filter the data and we eliminate the industrial areas [i.e. blast furnaces] or volcanoes,” Alberto Setzer, an INPE senior scientist involved in producing official fire data told Mongabay. “And I suspect most sites in the world don’t do this type of analysis.”
INPE has been monitoring fires for over 20 years and their system is useful for making comparisons of hotspot counts across time or within specific regions including states, municipalities, protected areas, or Indigenous territories. The hotspot data is also easy to overlay with satellite imagery, making it useful for local enforcement and management agencies or the media to pinpoint locations of interest for further investigation.
How do satellite fire detection tools work?
Hotspot data: It’s intuitive that light on earth can be detected from space, but how is heat detected without a thermometer on the ground? Much as the human eye can detect color variation in the visible light spectrum, satellites are outfitted with tools that can “see” temperature differences.
Fires emit most of their energy in the thermal infrared domain as “infrared light,” invisible to the naked eye but not to a satellite. One particular infrared wavelength (around 4000 nanometers) is especially associated with fires. Several different satellite instruments are used to detect this specific wavelength, allowing for the verification of the thermal signature, or the heat released, from fires on the ground.
These fires are pinpointed by looking for a contrast between a “hot pixel” or “hot spot” (coded yellow to red in an image) and the cooler surrounding pixels portrayed in other colors. The VIIRS instruments onboard the Suomi-NPP satellite (launched in 2012) and the NOAA20 satellite (launched in 2017) are the latest generation of these instruments and have an improved higher resolution of 375 meters. This more tightly focused pixel area allows for the detection of smaller or more low-intensity fires, such as those burning in the understory of a tropical forest. Higher resolution also means its easier to pinpoint a precise location.
However, “You have to be careful about making a distinction between fires and fire pixels,” says Louis Giglio. “Pixels are what you see from VIIRS,” he explains, cautioning against the equation of individual hotspots and fires. Giglio is a research professor at the University of Maryland who studies remote sensing of active fires and burned areas.
Aerosol data: MAAP uses aerosol index data to detect major fires, the idea being that a fire burning enough biomass — organic matter — to emit smoke plumes into the atmosphere is one big enough to be worthy of investigation.
Aerosols are particles suspended in the atmosphere (including smoke, dust, fog, mist, and pollution). Satellite sensors that measure aerosols detect the light scattered by these aerosols in contrast to the reflectance from the background (Earth).
The MODIS (Moderate Resolution Imaging Spectroradiometer) sensor on NASA’s satellites detects aerosols that come from fire (smoke), dust, pollution, but it does not always discriminate smoke from dust.
The TROPOMI sensor on the European Space Agency’s Sentinel-5P satellite, on the other hand, is quite sensitive to aerosol layer height as well as absorption, so it can differentiate between dust and smoke, as smoke rises higher into the atmosphere.
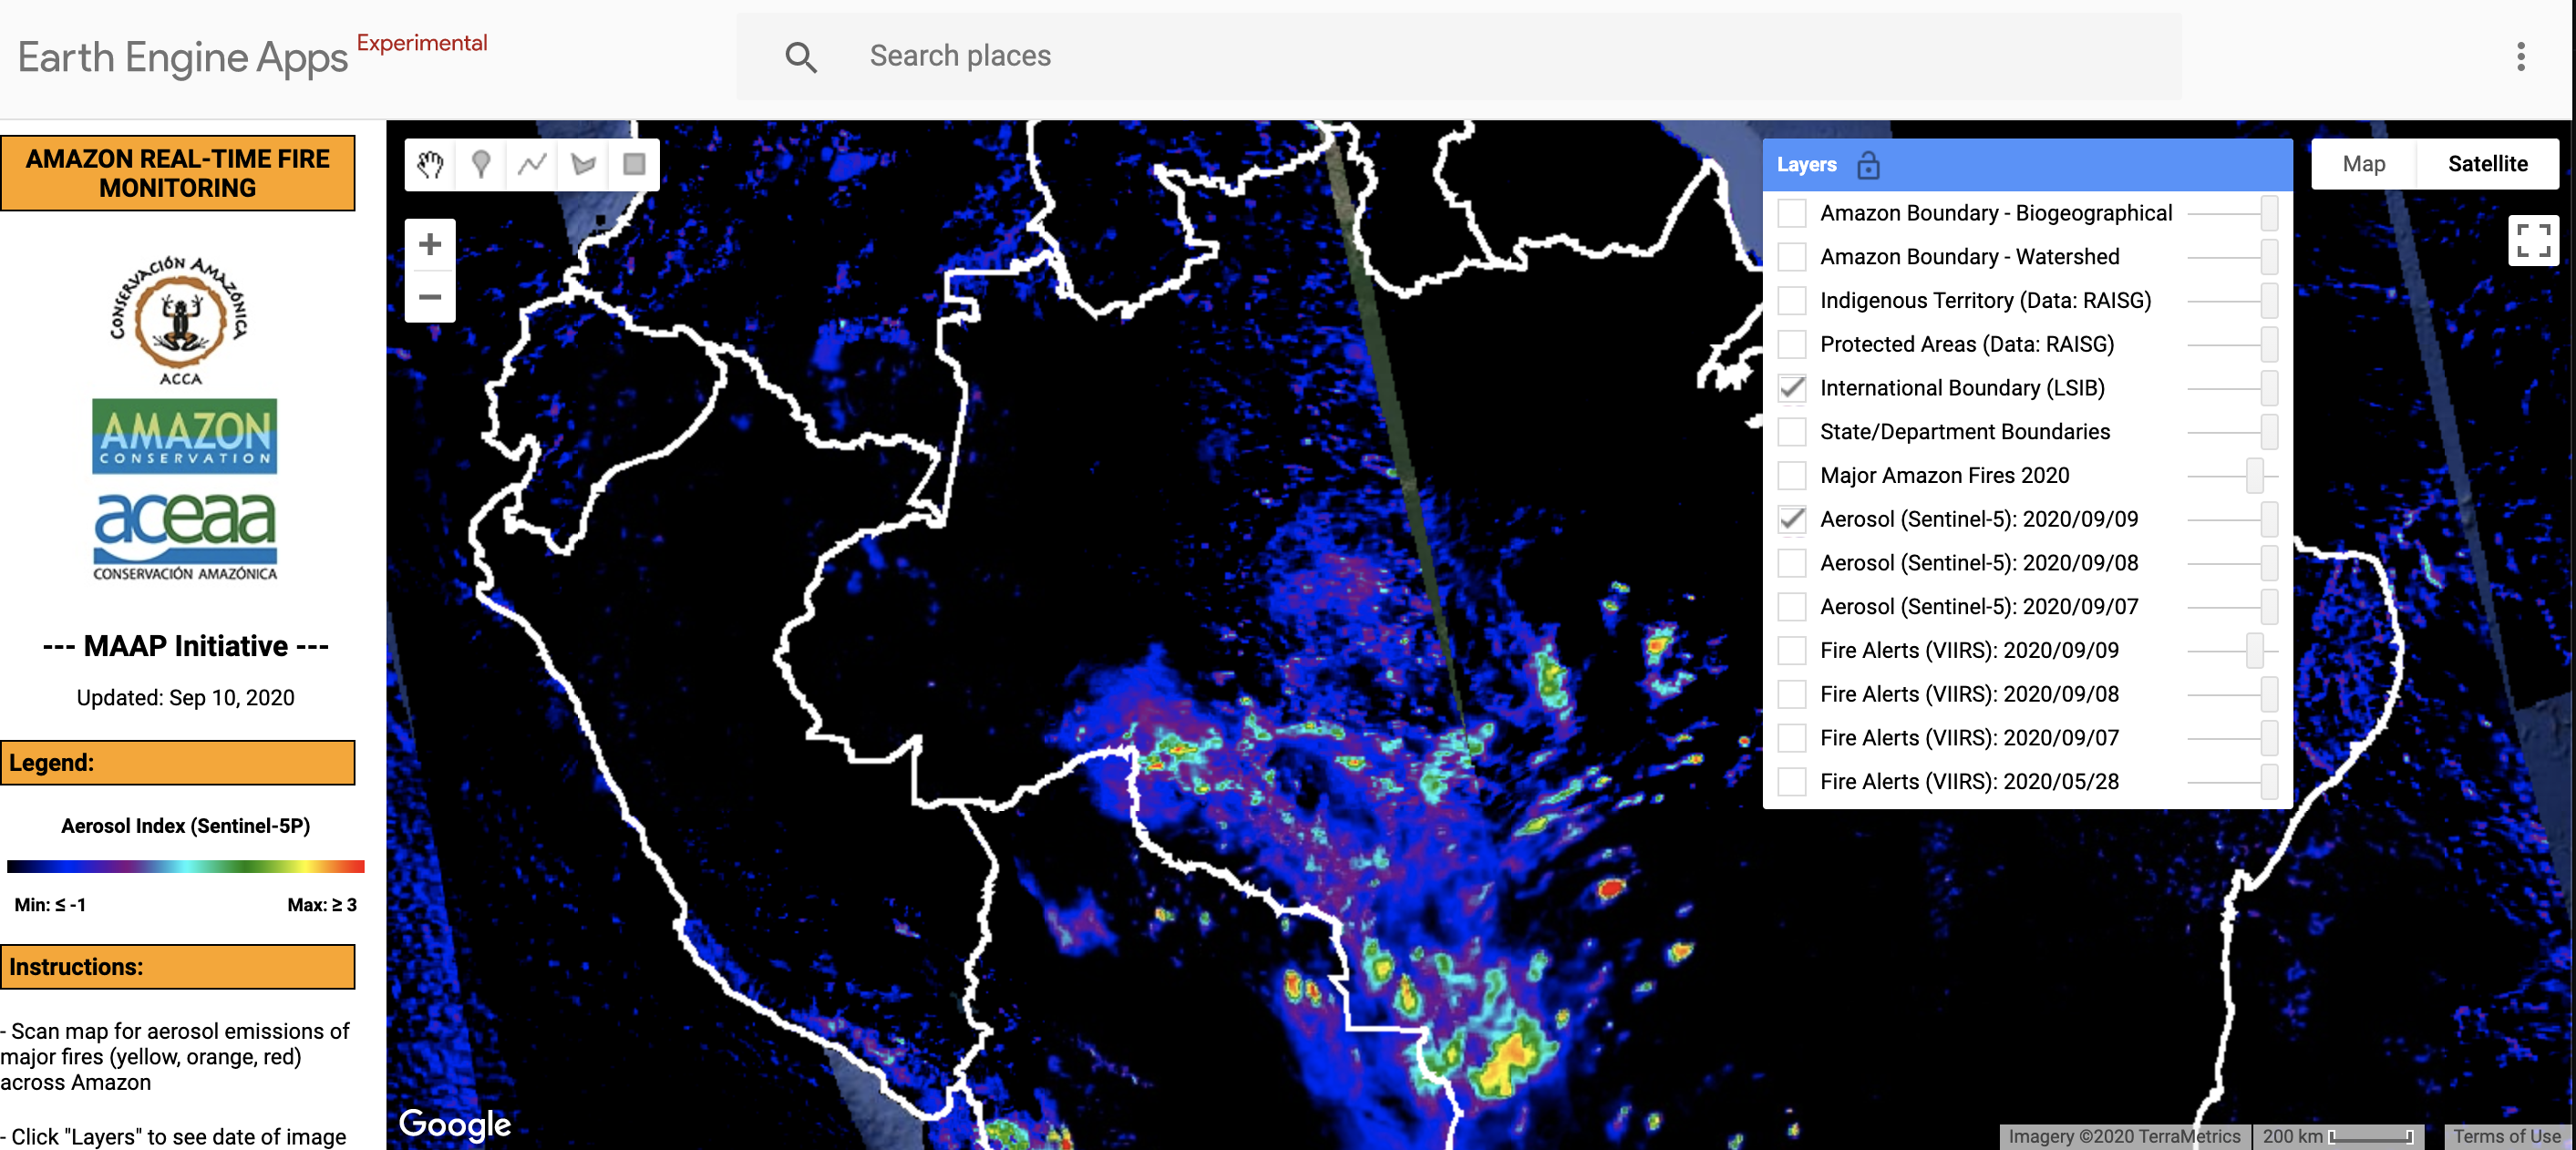
MAAP’s novel Real-time Amazon Fire Monitoring app shows aerosol emissions alerts by location on Sept 10, 2020. MAAP uses Sentinel-5P satellite data.
Some Widely-Used Fire Monitoring Satellite Tools:
Satellites detecting thermal signature (hot spots):
- NASA’s and NOAA’s joint Suomi NPP satellite detects thermal signatures with the VIIRS(Visible Infrared Imaging Radiometer Suite) at 375 meter resolution.
- NOAA’s NOAA-20 satellite detects thermal signatures with the VIIRS (Visible Infrared Imaging Radiometer Suite) at 375 meter resolution.
- NASA’s Terra and Aqua satellites detect thermal signatures with the MODIS (Moderate Resolution Imaging Spectroradiometer) instrument at 1000 meter resolution.
Satellites detecting aerosols (smoke particles):
- European Space Agency satellite Sentinel-5P detects aerosol emissions with the TROPOMI
- NASA’s Terra and Aqua satellites detect aerosol emissions with the MODIS (Moderate Resolution Imaging Spectroradiometer) sensor.
How does all of this information translate into action?
Although INPE, Brazil’s national space research institute, has access to all of the tools and monitoring methods mentioned here, as well as possessing its own advanced methods for detecting Amazon fires, how decisionmakers use this information depends on political will, current policies, enforcement actions and suppression capabilities.
“They [INPE] have wonderful resources, really impressive,” Kátia Fernandes, a climate scientist at the University of Arkansas said. “So, knowing where deforestation is happening, where fires are occurring, this is not a bottleneck for taking action. What does change over time is investment in law enforcement.”
A moratorium on burns was issued on July 15, 2020 by the Bolsonaro administration, making all subsequent intentionally set Amazon fires illegal. Since that time, INPE’s data has been used to prosecute and fine some offenders. But the funding and organizational capacity of fire control and enforcement agencies such as IBAMA, Brazil’s environmental agency, have been significantly curtailed by the current government. And reportedly, efforts by the Army to control this year’s fires have been insufficient.

A fire in the the Pantanal region of Corumbá, generating immense environmental and public health damage. Ibama teams and other institutions fight fire fronts with great difficulty in moving. Photo courtesy of IBAMA
State of the art satellite monitoring and moratoriums do little good when regulatory agencies lose the support and funding they require to conduct boots-on-the-ground fire control, or the ability to prosecute those who set illegal fires. IBAMA, for example, given the job of patrolling and fighting fires across the entire Amazon basin, is operating this year with just five helicopters.
“No matter how much technology we throw out at this [fire crisis], or how many better methods or algorithms or AI or whatever,” Giglio said, “nothing’s going to change until you address the problems on the ground.”
*
Note to readers: please click the share buttons above or below. Forward this article to your email lists. Crosspost on your blog site, internet forums. etc.
Liz Kimbrough is a staff writer for Mongabay. Find her on Twitter: @lizkimbrough_